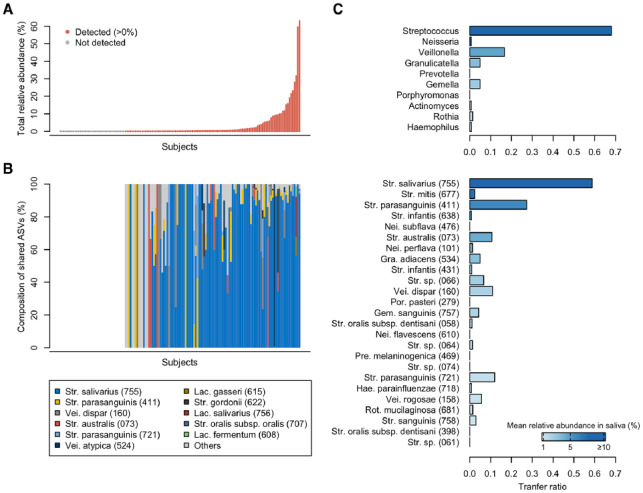
Figure 2.
Microbial sharing between salivary and gut microbiota. (A) Total relative abundance of shared amplicon sequence variants (ASVs) in gut microbiota. The abundance in each subject is shown in ascending order. Red and gray colors indicate detection (>0%) and no detection of shared ASVs, respectively. (B) The composition of shared ASVs detected in gut microbiota. Each bar chart corresponds directly to the upper abundance in panel A. Bacterial species with ≥1% of relative abundance in any subject are shown. Human microbial taxon (HMT) numbers in the eHOMD are given in parentheses following bacterial names. Lac., Lactobacillus; Str., Streptococcus; Vei., Veillonella. (C) Transfer ratio of predominant genera and species of salivary microbiota. Ten genera and 25 species with ≥1% of mean relative abundance in salivary microbiota are listed in descending order of their mean relative abundance in salivary microbiota. Gem., Gemella; Gra., Granulicatella; Hae., Haemophilus; Nei., Neisseria; Por., Porphyromonas; Pre., Prevotella; Rot., Rothia.

