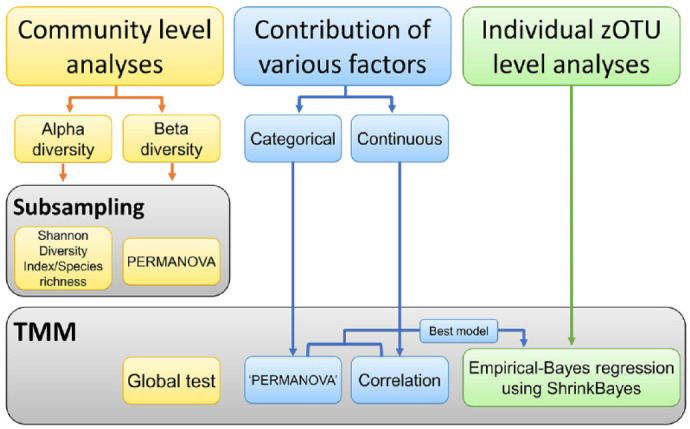
Figure 1.

The flow diagram with the type of data set normalization per analysis type. Community-level analyses (yellow rectangles) were performed in both subsampled and trimmed mean of M-value (TMM) normalized data sets. Contribution of the various caries risk factors to the oral microbiome (blue rectangles) and individual zero-radius operational taxonomic unit–level analyses (green rectangles) were done on TMM normalized data sets.
