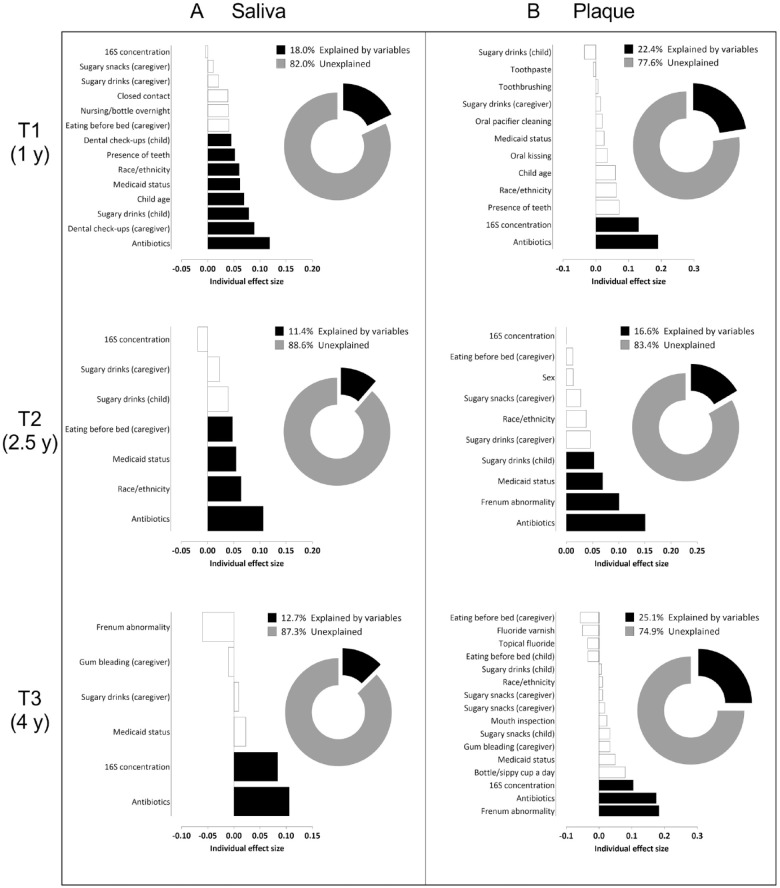
Figure 3.
Variables associated with the salivary (A) and dental plaque (B) microbiome variation at T1, T2, and T3. Bar graphs depict the individual effect sizes of the variables selected as significantly influencing the microbiome composition. The black bars indicate the variables contributing to the best model based on the bioenv function. Bars with negative values mean that, even if the variable had a significant effect on the microbiome, it did not explain variation between samples. A variable can have a negative effect size if it is taken alone but contributes positively to the variation in combination with other variables. Pie charts show the percentage (%) of the explained variation of the microbiome composition with a combined effect size coming from the best combination of the selected variables (best model) (black part) and unexplained part of the microbiome (gray part).

