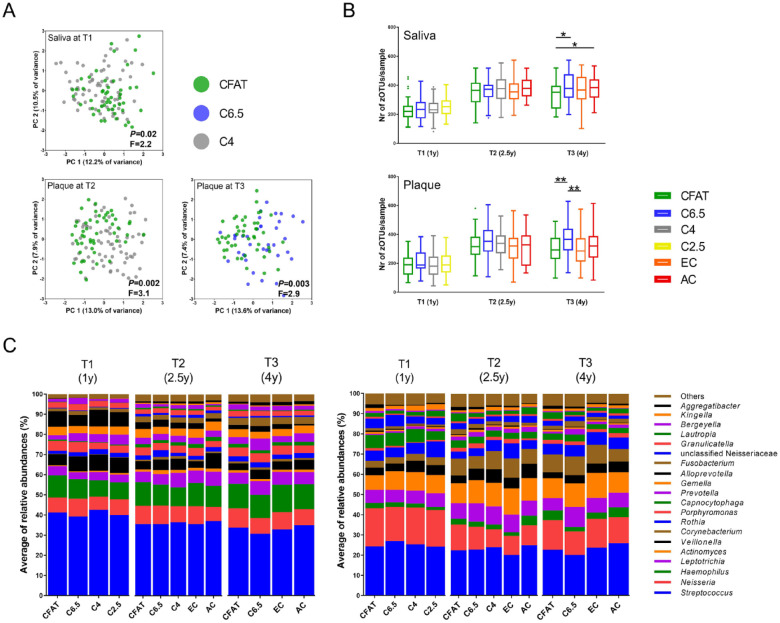
Figure 4.
Microbial profile analyses of the salivary and dental plaque microbiome of the children over time (T1, T2, T3). (A) Principal component analysis (PCA) plots displaying the microbial profiles of the samples in the caries free at all time points (CFAT), C6.5, and C4 groups. Axes show the first 2 principal components (PCs) explaining the largest intersample variation (percentage of variance). The P and F values indicate the output of PERMANOVA analyses, using Bray–Curtis similarity. The P values were corrected for multiple testing using Bonferroni correction. (B) The α-diversity presented as species richness of the microbial composition in both salivary and dental plaque samples of the children according to their caries statuses over time. The boxplots are plotted using Tukey’s method. Statistically significant differences within the respective caries group are indicated by asterisks: *P < 0.05 and **P < 0.01 (Kruskal–Wallis test and Mann–Whitney test with Bonferroni correction). Different colors of the boxes indicate caries groups. Green boxes, CFAT (n = 50); blue, caries at 6.5 y (C6.5) (n = 38); gray, caries at 4 y (C4) (n = 70); yellow, caries at 2.5 y (C2.5) (n = 75); orange, early caries (EC) (International Caries Detection and Assessment System [ICDAS] score 1 and 2) (T2: n = 63; T3: n = 75); and red, advanced caries (AC) (ICDAS ≥ 3) (T2: n = 13; T3: n = 52) at the respective clinical examination. Lines connect the caries groups that differed within a time point. (C) Taxonomic distribution of the mean relative abundance of reads of the top 20 most abundant bacterial genera in salivary (left plot) and dental plaque (right plot) samples of the children according to their caries groups over time.

