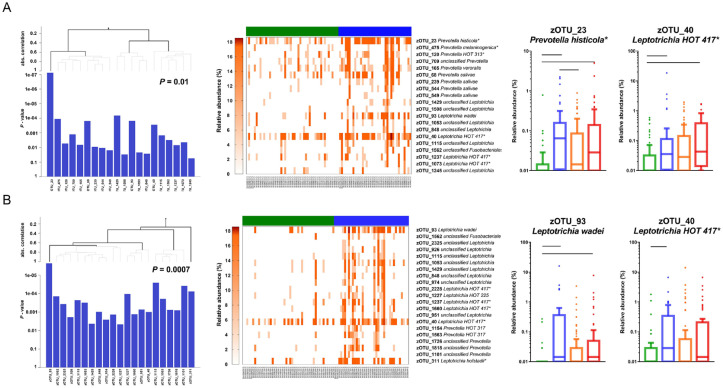
Figure 5.
Differences in microbial composition between children with different caries status. The output of the global test comparing the composition of (A) salivary and (B) dental plaque samples collected at 4 y of age (T3) in children who remained caries free at all time points (CFAT) (n = 50) with those who were diagnosed with caries at 6.5 y (C6.5) (n = 38) but were caries free at the time of the sample collection (4 y). The bar graphs with dendrograms show the zero-radius operational taxonomic units (zOTUs) selected with the global test (P is the overall P value) and contributing to the significant differences in (A) salivary and (B) dental plaque samples. The dendrogram at the top shows single zOTUs and zOTU groups associated with the caries groups (in this case, all associated with C6.5, blue), with the absolute correlation from the global test at the upper y-axis. The lower y-axis shows the logarithmic P values corresponding to the tests for the associations of each individual zOTU with the caries group, plotted such that the longest bar has the lowest P value. The heatmaps show the relative abundance of the same zOTUs and zOTU groups in the same order as in the bar graphs in (A) salivary and (B) dental plaque samples in the CFAT (green) and C6.5 (blue) groups. The boxplots show examples of zOTUs selected with the global test in (A) salivary and dental (B) plaque samples by caries group: the CFAT, green; C6.5, blue; early caries (EC), orange; and advanced caries (AC), red. Lines connect the statistically significantly different groups. *Indicates zOTUs additionally blasted on the HOMD website with similarity ≥98.5%. The number of zOTUs per group, taxonomic names, and individual P values of all selected zOTUs are listed in Appendix Table 3A.

