
FIGURE 3. Adaptive multiscale representation and coloring.
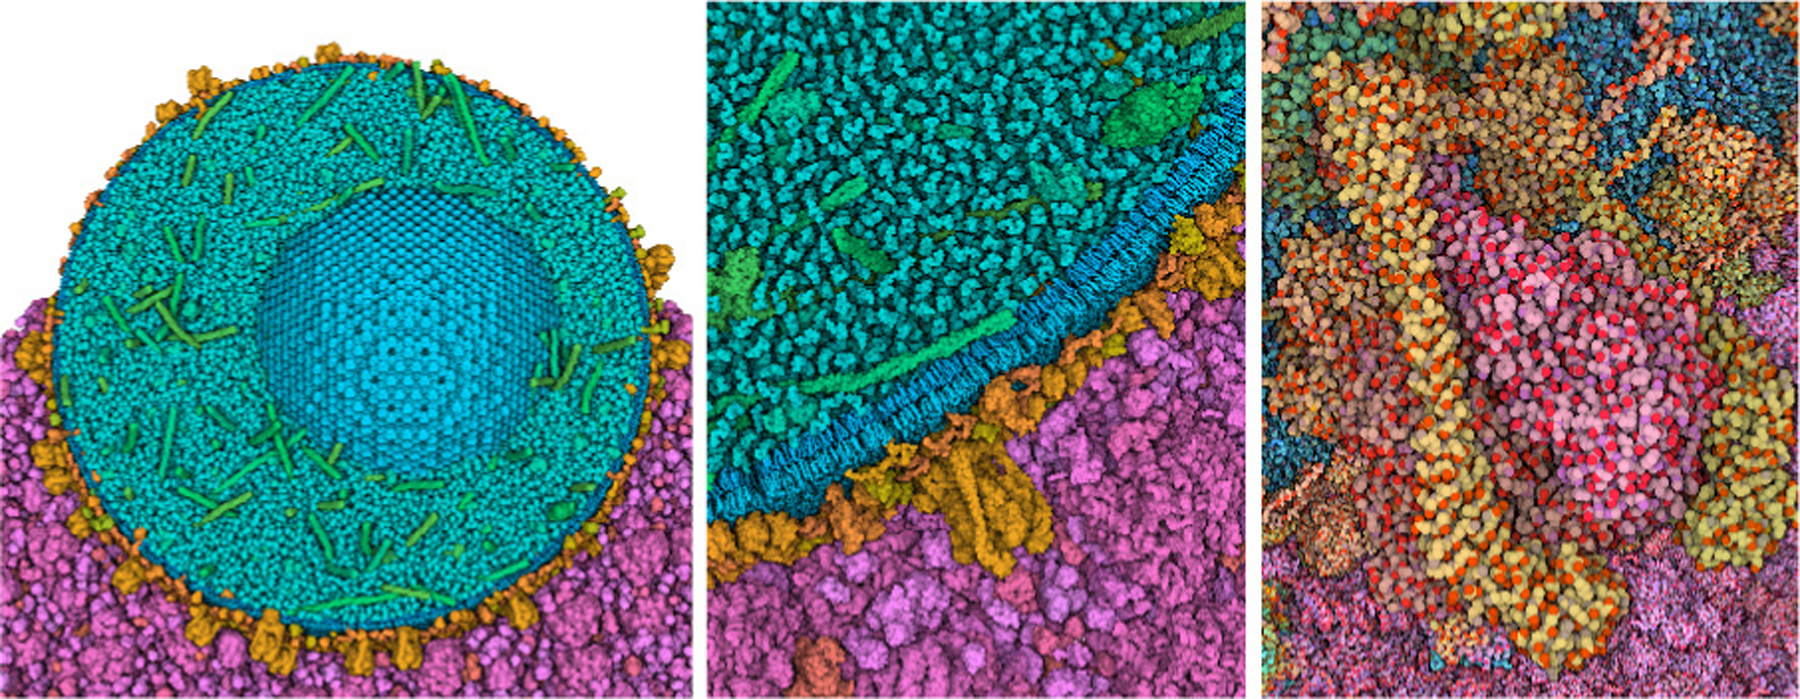
Model of an insulin secretory granule (blue, green and orange) and cytoplasm (magenta) is displayed with subunit colors and coarse surfaces at left. As the user zooms in, the view progressively changes to a full atomic representation with atomic color (right). Images by Ludovic Autin.