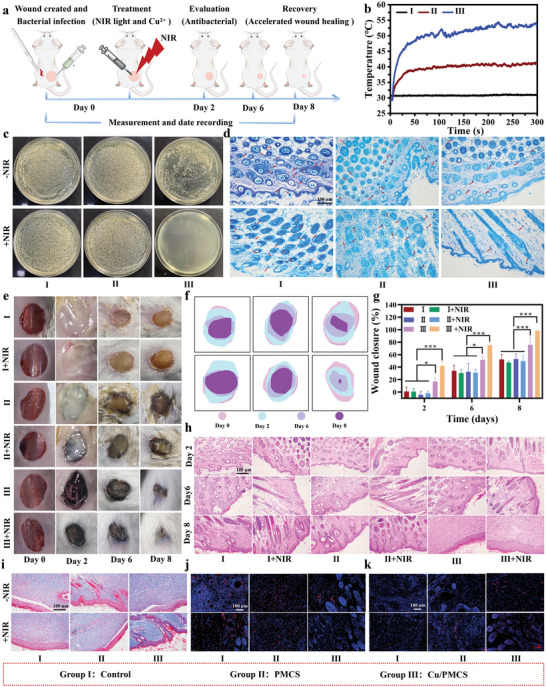
Figure 8.

The antimicrobial and wound‐healing protocol in vivo. a) Treatment protocol for the infected full‐thickness wound‐healing model. b) Temperature change curves of the mouse wound sites under 808 nm NIR irradiation with power density of 0.7 W cm−2 for 5 min. c) Bacterial colony photos of the wounded skin. d) Giemsa staining of different groups (Deep purple: bacterial colonies). e) Wound photographs of the mice from Day 0 to Day 8 and f) the corresponding traces. g) The wound closure areas after various treatments at different time points. h) HE staining of the bacteria‐infected tissues after the different treatments. i) Masson staining (blue: Collagen fibers), j) CD68 staining (purple: DAPI, red: CD31), and k) CD31 staining (purple: DAPI, red: CD68) of different groups on Day 8. Data represent means ± SD (n = 4). Statistical significance was calculated by two‐way ANOVA analysis. *p < 0.05; **p < 0.01; ***p < 0.001.
