
Figure 1.
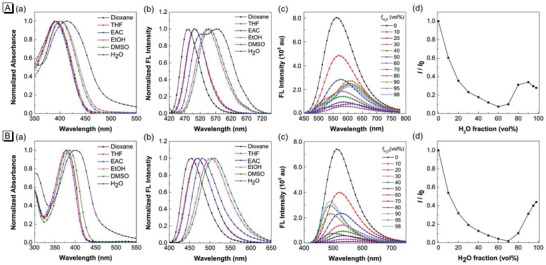
Normalized absorption a) and FL b) spectra of TPAQ (A) and TPAP (B) in different solvents; FL spectra c) of TPAQ (A) and TPAP (B) in EtOH and EtOH/H2O mixtures with different H2O fractions (f H2O); d) Changes in the FL peak intensities (I) of the solutions of TPAQ (A) and TPAP (B) with the H2O contents in the EtOH/H2O mixtures. I 0 is the intensity in pure EtOH. Concentration: 10 µM.