
Figure 2.
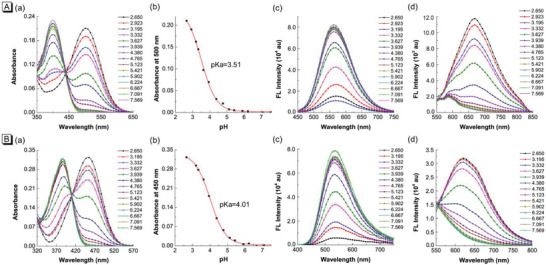
a) Absorption spectra of TPAQ (A) and TPAP (B) in EtOH/PBS (v:v = 1:1) solvents at different pH values; b) Plots of the absorbance of TPAQ (A) and TPAP (B) at different pH values and the fitted curve; c) FL spectra of TPAQ (A) and TPAP (B) excited at 400 and 380 nm, respectively; d) FL spectra of TPAQ (A) and TPAP (B) excited at 500 and 450 nm, respectively. Concentration: 10 µM.