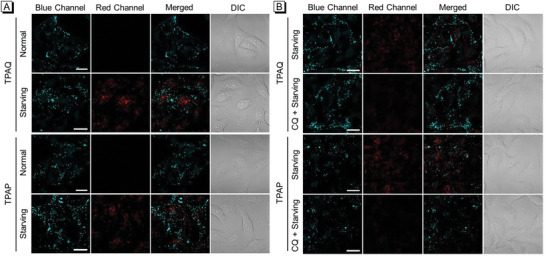
Figure 3.

Confocal laser scanning microscopy (CLSM) images of live A549 cells stained with 2 µM TPAQ and TPAP under normal and starving conditions, respectively A), and under starving and CQ‐treated starving conditions, respectively B). Blue channel: λ ex = 405 nm, λ em = 410–480 nm; Red channel: λ ex = 488 nm, λ em = 600–700 nm. Scale bar = 20 µm.
