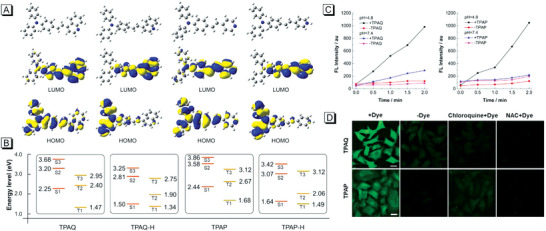
Figure 4.

A) Optimized geometries and the frontier orbitals of TPAQ, TPAQ‐H, TPAP, and TPAP‐H; B) Diagram of energy level of singlet and triplet states of TPAQ, TPAQ‐H, TPAP, and TPAP‐H based on optimized singlet geometries; C) Changes of FL intensity at 535 nm of DCF‐DA in the presence or absence of TPAQ/TPAP in PBS with pH = 4.8 or pH = 7.4 under light irradiation for different time points; D) CLSM images of live A549 cells under starvation treated with “DCF‐DA + TPAQ/TPAP”, “DCF‐DA”, “DCF‐DA + chloroquine + TPAQ/TPAP”, “DCF‐DA + NAC + TPAQ/TPAP” with light irradiation for 5 min. Scale bar = 20 µm.
