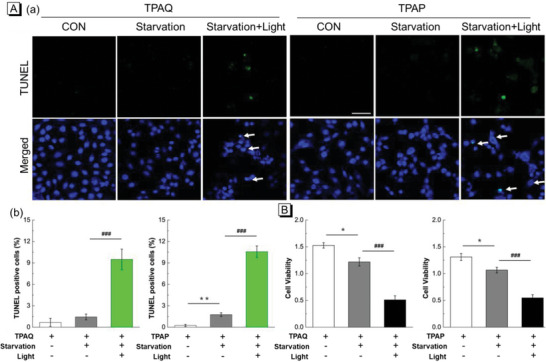
Figure 6.

A) TUNEL staining of fixed A549 cells pre‐stained with 20 µM TPAQ and TPAP, respectively, in “normal”, “starvation”, and “starvation + light” conditions (a) and statistics of TUNEL positive cells (b) in relevant conditions in a; TUNEL: λ ex = 488 nm, λ em = 500–600 nm, DAPI: λ ex = 405 nm, λ em = 420–480 nm, Scale bar = 50 µm; B) Cell viability of A549 cells stained with 20 µM TPAQ and TPAP in “normal”, “starvation”, and “starvation + light” conditions. Power density: 50 mW cm−2. Bar graphs are presented as mean ± S.E. *P<0.05, **P<0.01 versus control group, ###P<0.001 versus no‐light group in unpaired two‐tailed t test.
