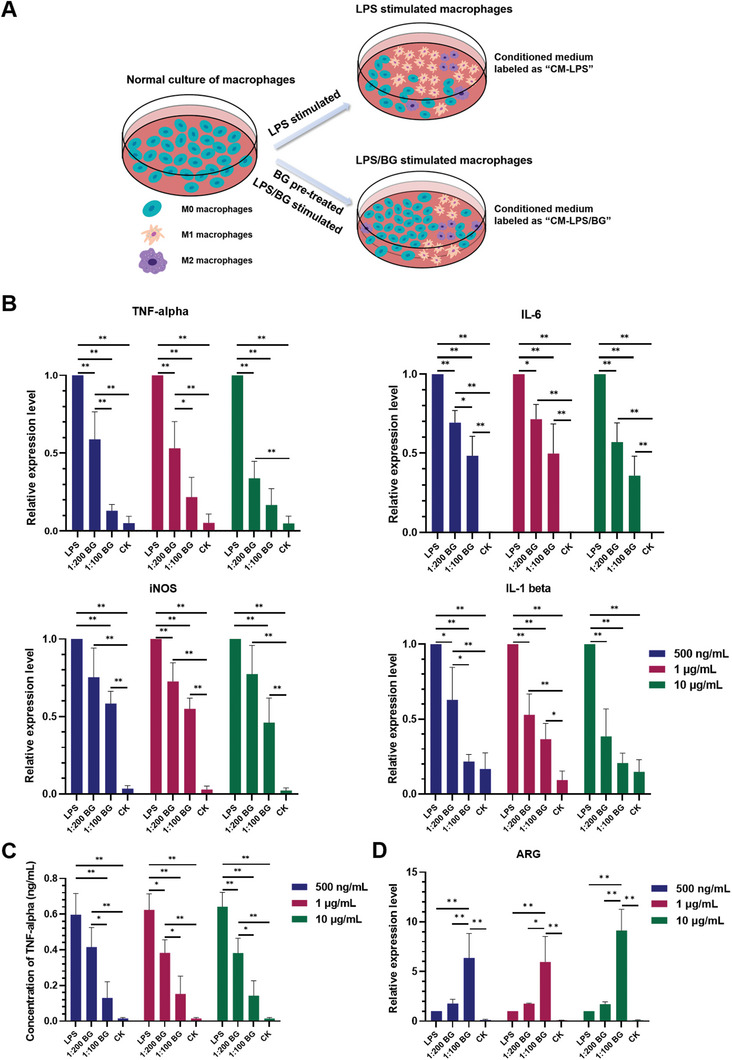
Figure 2.

Effect of BG on inflammatory macrophages stimulated with different concentrations of LPS (500 ng mL‐1, 1 µg mL‐1, 10 µg mL‐1). A) Schematic diagram of various treatments of RAW and the collection of conditioned media. B) Expression of pro‐inflammatory genes (TNF‐alpha, IL‐6, iNOS, IL‐1 beta) in RAW after different treatments. (“LPS”: stands for incubation of RAW with LPS; “BG”: stands for incubation of RAW with LPS following pretreatment with BG extract liquid at 1:100 or 1:200 dilution ratio; “CK”: stands for RAW cultured with normal medium) C) Concentration of TNF‐alpha in the culture media in RAW after different treatments. D) Expression of anti‐inflammatory gene ARG in RAW after different treatments. (n = 3, * indicates p < 0.05, ** indicates p < 0.01)
