
Figure 5.
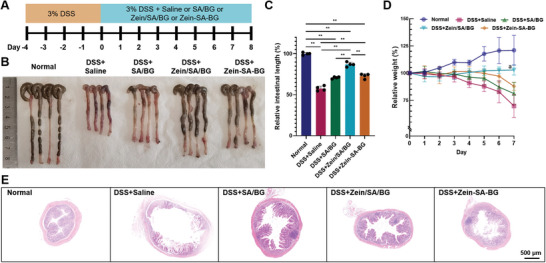
Therapeutic effect of BG‐based treatment in DSS‐induced acute colitis mice. A) Timeline of the in vivo experiment. B) Gross image of the large intestine from normal mice and DSS‐induced mice after different treatments. (“Normal” stands for the large intestine from normal mice; “DSS+Saline” stands for the large intestine from DSS‐induced mice treated with saline; “DSS+SA/BG” stands for the large intestine from DSS‐induced mice treated with the SA/BG microspheres; “DSS+Zein/SA/BG” stands for the large intestine from DSS‐induced mice treated with the Zein/SA/BG microspheres; “DSS+Zein‐SA‐BG” stands for the large intestine from DSS‐induced mice treated with the mixture of Zein protein, SA and BG powders) C) Relative length of large intestine of normal mice and DSS‐induced mice after different treatments. D) Relative weight changes of normal mice and DSS‐induced mice after different treatments. E) H&E staining of the large intestine from normal mice and DSS‐induced mice after different treatments. (n = 4, ** indicates p < 0.01, “a” indicates p < 0.05 between DSS+Zein/SA/BG and normal and p < 0.01 between DSS+Zein/SA/BG and {DSS+Zein‐SA‐BG, DSS+SA/BG, and DSS+saline}).