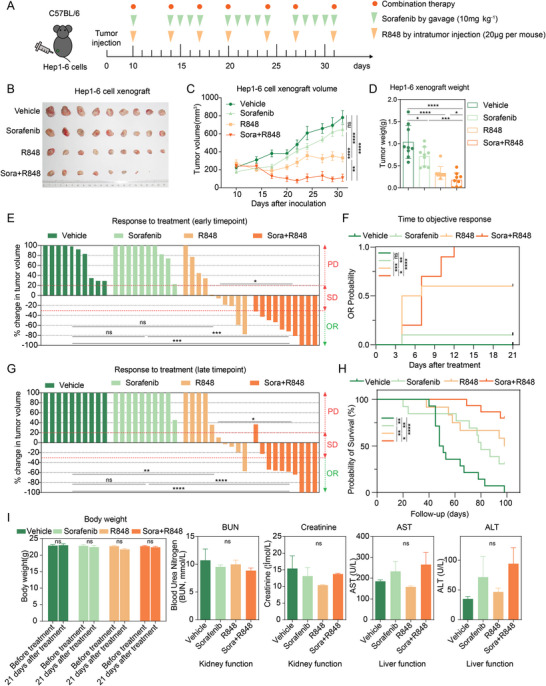
Figure 1.

Combination therapy with R848 and low‐dose sorafenib (10 mg kg−1) significantly increases antitumor activity and prolongs mouse survival, with few toxic side effects, in the syngeneic Hepa1‐6 model. A) The timeline and schedule of procedures in the Hepa1‐6 subcutaneous tumor‐bearing model. Hepa1‐6 mouse HCC cells were subcutaneously injected into C57BL/6 mice. When the tumor volume reached ≈200 mm3, the mice were treated with sorafenib (10 mg kg−1) intragastrically, with R848 (20 µg per mouse), with sorafenib combined with R848, or with vehicle (n = 9 mice per group) until they met the treatment endpoint. B) Representative photographs of subcutaneous Hepa1‐6 HCC tumors after the indicated treatments. C) Growth curve of Hepa1‐6 tumors at the indicated time points. D) Tumor weight at the endpoint after the indicated treatments. E) Response to treatment at the early time point on the 21st day (n = 10 mice per group). The difference in the PD rate is indicated by the upper part, while the difference in the ORR is indicated by the lower part. F) The time to objective response in mice after the indicated treatments. G) Response to treatment at the late time point on the 31st day (n = 10 mice per group). H) Kaplan‒Meier survival curves of treated mice (vehicle, n = 14; sorafenib, n = 13; R848, n = 12; sorafenib+R848, n = 15). I) The effects of sorafenib and/or R848 treatment on body weight and kidney and liver function in mice bearing Hepa1‐6 xenografts after treatment for 21 days. Serum levels of BUN, creatinine, AST, and ALT were measured in all treatment groups after the experiment (n = 9 mice per group). PD, progressive disease. SD, stable disease. OR, objective response. AST, aspartate aminotransferase. ALT, alanine transaminase. The error bars indicate the means ± SEMs; ns: p > 0.05, * p < 0.05, ** p < 0.01, *** p < 0.001, **** p < 0.0001, one‐way ANOVA C–G,I), log‐rank test H).
