Figure 2.

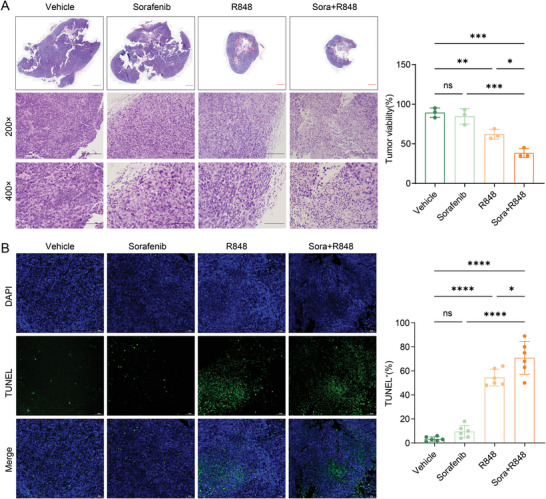
Combination therapy with R848 and low‐dose sorafenib significantly promotes tumor apoptosis and immune infiltration. A) The landscape and representative images of H&E staining of tumor tissues from four groups are shown (200× & 400×). Scale bars, 2000, 200, and 100 µm. The dashed box on the left shows the necrotic area of the tumor tissues after the indicated treatments, and the histogram on the right shows the percentage of viable tumor cells. B) TUNEL assay of tumor samples (40×). Representative staining images (left) and TUNEL‐positive cell rates (right) are shown. Scale bar, 100 µm. The error bars indicate the means ± SEMs; ns: p > 0.05, * p < 0.05, ** p < 0.01, *** p < 0.001, **** p < 0.0001, one‐way ANOVA.
