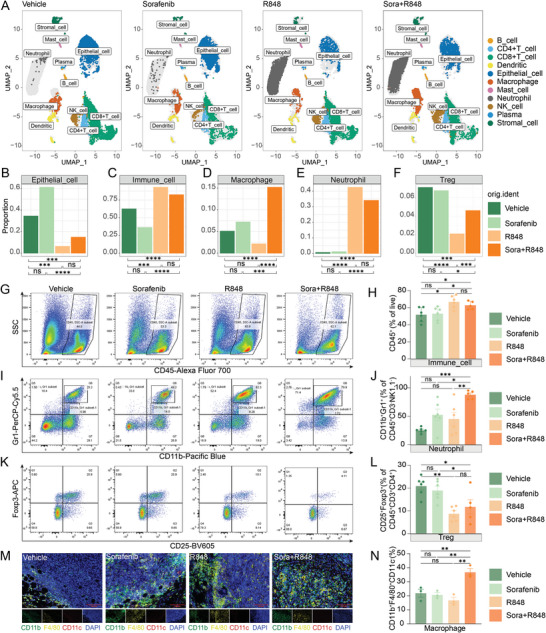
Figure 3.

Combination treatment with R848 and low‐dose sorafenib alters the tumor microenvironment. A) Tumor tissues from the four groups after the indicated treatments were processed into single‐cell suspensions, and unsorted cells were used for 10× Genomics scRNA‐seq. The UMAP plots of tumor tissues showed 11 clusters, including clusters corresponding to major immune cell subtypes and tumor cells. Each cluster is presented in a different color based on the analysis of single‐cell transcriptome data. B–F) Bar plots showing the proportions of 5 major cell types in different tumor tissues after the indicated treatments: epithelial cells B), immune cells C), macrophages D), neutrophils E), and Tregs F). G–L) Flow cytometric analysis of tumor‐infiltrating immune cells in the Hepa1‐6 syngeneic mouse model after treatment with vehicle, sorafenib (10 mg kg−1), R848, or the combination for 12 days, as described in Figure S4C in the Supporting Information, shown by the proportions of the parent gates. Representative flow cytometric plots of total CD45+ immune cells G), neutrophils (CD45+CD3−NK1.1−CD11b+Gr1+) I), and Tregs (CD45+CD3+CD4+CD25+Foxp3+) K) in the 4 treatment groups are shown. The corresponding proportions of immune cells H), neutrophils J), and Tregs L) after the indicated treatments were quantified by flow cytometry (n = 5 or 6 mice per group). The main flow cytometry gating scheme is shown in Figures S4C and S7D in the Supporting Information. M) Representative image of macrophages (CD11b+F4/80+CD11c−DAPI+) identified by multiplex immunofluorescence staining in the 4 treatment groups. N) The percentage of macrophages in (M) is shown in a bar graph (n = 3 mice per group). Scale bar, 100 µm. The error bars indicate the means ± SEMs; * p < 0.05, ** p < 0.01, *** p < 0.001, **** p < 0.0001, Fisher's exact test B–F), one‐way ANOVA H–N).
