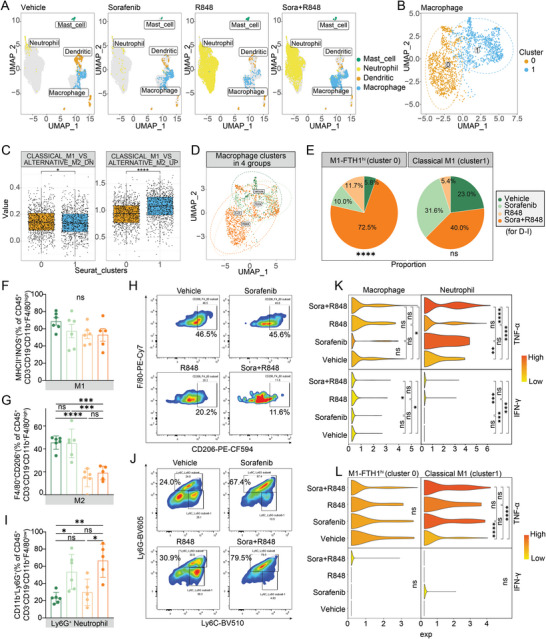
Figure 4.

Combination treatment with R848 and low‐dose sorafenib increases the proportion and activation of antitumor macrophages and neutrophils. A) UMAP plots of tumor tissues showing myeloid cells, including mast cells, neutrophils, DCs, and macrophages. Each cell is shown in a different color based on the analysis of single‐cell transcriptome data. B) Unsupervised UMAP clustering identified two macrophage clusters (cluster 0 and cluster 1) in tumor tissues after the combination treatment. C) GSEA of the above mentioned two macrophage clusters based on the gene expression profile enrichment score linked the signals of genes downregulated or upregulated in classical M1 macrophages versus alternative M2 macrophages using GSE5099. D) The distribution of these two macrophage clusters in the 4 treatment groups. E) Pie chart showing the proportions of these two macrophage types (FTH1high M1 (left) and classical M1 (right)) in tumor tissues after vehicle, sorafenib (10 mg kg−1), R848, and combination treatment. F–J) The proportions of M1 macrophages (CD45+CD3−CD19−CD11b+F4/80highMHCII+INOS+) F), M2 macrophages (CD45+CD3−CD19−CD11b+F4/80highCD206+) G) and Ly6G+ neutrophils (CD45+CD3−CD19−CD11b+F4/80lowLy6G+) I) after the indicated treatments were quantified by flow cytometry (n = 5 or 6 mice per group). Representative flow cytometric plots of M2 macrophages H) and Ly6G+ neutrophils J) in the 4 treatment groups. K,L) Expression levels of TNF‐α and IFN‐γ in different types of macrophages and neutrophils after the indicated treatments. The error bars indicate the means ± SEMs; ns: p > 0.05, * p < 0.05, ** p < 0.01, *** p < 0.001, **** p < 0.0001, one‐way ANOVA E,F,G,I), t‐test C,K,L).
