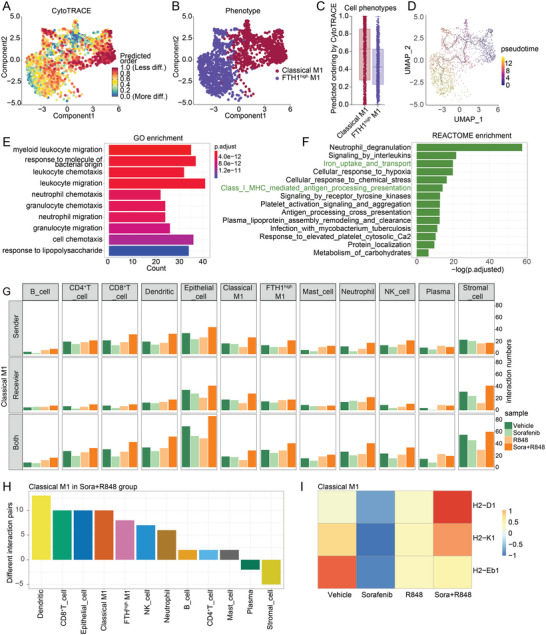
Figure 5.

Combination treatment with R848 and low‐dose sorafenib promotes the transition of classical M1 macrophages into FTH1high M1 macrophages and enhances the DC–classical M1 interaction, resulting in enhanced tumor antigen presentation to T cells. A,B) CytoTRACE prediction of the differentiation states in the two macrophage phenotypes based on scRNA‐seq data. The predicted order value indicates the degree of differentiation. C) Boxplot showing the comparison of the predicted ordering between classical M1 and FTH1high M1 macrophage subsets by CytoTRACE. D) Combined application of CytoTRACE and Monocle3 to predict the origin of FTH1high M1 macrophages and verify the trajectories from classical M1 to FTH1high M1 macrophages along pseudotime. E) Gene ontology (GO) enrichment analysis and F) Reactome enrichment analysis of the upregulated genes during transition of M1 macrophages into FTH1high M1 macrophages. P values were adjusted for multiple test correction using the Benjamini–Hochberg procedure, and differences were considered significant when adjusted p values were less than 0.05. G) CellPhoneDB analysis showed the interactions between classical M1 macrophages and other cells in the TME based on ligand–receptor interactions in the 4 treatment groups. H) The bar graph shows the numbers of ligand–receptor interaction pairs between classical M1 macrophages and other cell types observed in the combination group. I) Heatmap showing the levels of H2‐D1, H2‐K1, and H2‐Eb1 in classical M1 macrophages in the 4 treatment groups. Red color represents an expression level above mean and blue color represents expression level lower than mean.
