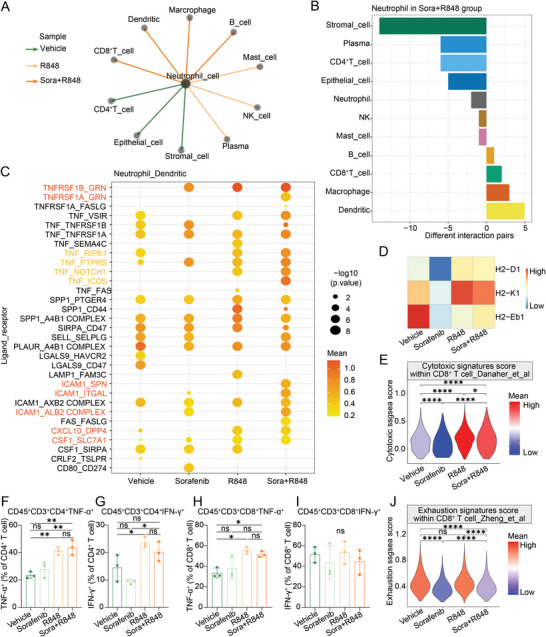
Figure 6.

Combination treatment with R848 and low‐dose sorafenib promotes an increase in neutrophil interactions with DCs for antigen presentation to T cells, resulting in CD8+ T‐cell‐mediated antitumor immunity. A) Based the CellphoneDB analysis results, each line and its color represent the treatment group in which neutrophils have the most interactions with other cell types among the four groups. B) The bar graph shows the numbers of ligand–receptor interaction pairs between neutrophils and other cell types observed in the combination group. C) Overview of the ligand–receptor interactions between neutrophils and DCs predicted using CellPhoneDB. The statistical significance was estimated using ‐log10 transferred values. D) Heatmap showing the levels of H2‐D1, H2‐K1, and H2‐Eb1 in DCs in the 4 treatment groups. E) ssGSEA of the cytotoxic signature score in CD8+ T cells in tumor tissues after the different treatments. F–I) Flow cytometric analysis of the ability to secrete TNF‐α and IFN‐γ in CD4+ T cells and CD8+ T cells in the Hepa1‐6 syngeneic mouse model treated with vehicle, sorafenib (10 mg kg−1), R848, and combination for 12 days as described in Figure S7 of the Supporting Information, shown by the proportions of parent gates. T‐cell function panel, including the expression of TNF‐α and IFN‐γ on T cells, shown in bar graph (n = 3 per group). J) ssGSEA of the exhaustion signature score in CD8+ T cells in the 4 treatment groups. The Error bars indicate the means ± SEMs; ns: p > 0.05, * p < 0.05, ** p < 0.01, *** p < 0.001, **** p < 0.0001, one‐way ANOVA G–J), t‐test F,K).
