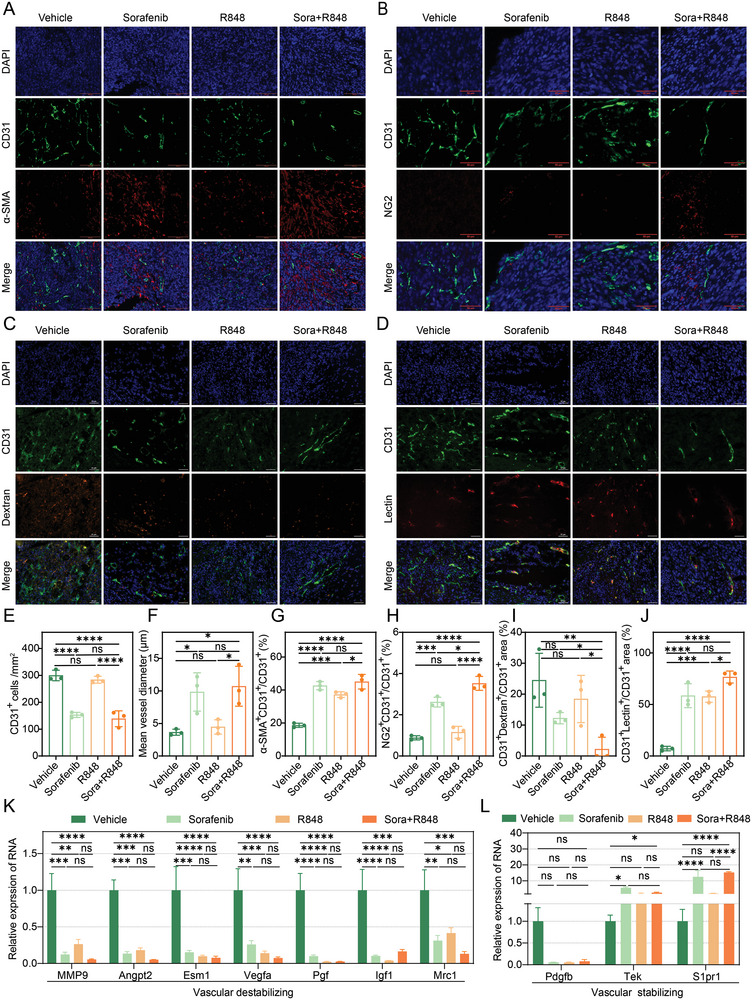
Figure 7.

Treatment with low‐dose sorafenib alone or in combination with R848 normalizes the tumor vasculature. A–D) Representative immunofluorescence images of CD31 (green), α‐SMA, NG2, dextran and lectin (red), and DAPI (blue) staining in tumor tissues from Hepa1‐6 syngeneic mouse models treated with vehicle, sorafenib (10 mg kg−1), R848 or sorafenib+R848 for 12 days. Scale bars, 100 µm A), 50 µm B–D). E–J) Immunofluorescence image quantification results. Relative number of CD31+ cells E), tumor vessel diameter F), relative proportions of α‐SMA+ covered blood vessels G), NG2+ pericyte‐covered blood vessels H), dextran+ blood vessels I), and lectin+ blood vessels J) in tumor tissues from Hepa1‐6 syngeneic mouse models treated with vehicle, sorafenib (10 mg kg−1), R848 or sorafenib+R848 for 12 days. K,L) The expression levels of genes associated with vascular distability K) or stability L) detected by RT‐PCR in tumor tissues from mice treated with vehicle, sorafenib (10 mg kg−1), R848 or sorafenib+R848 for 12 days. The error bars indicate the means ± SEMs; ns: p > 0.05, * p < 0.05, ** p < 0.01, *** p < 0.001, **** p < 0.0001, one‐way ANOVA E–L).
