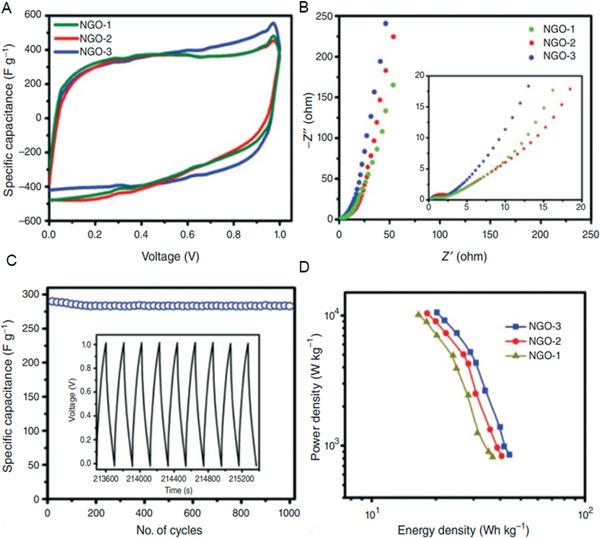
Figure 5.

A) Cyclic voltammograms of NGOs at a scan rate of 20 mV s−1. B) Nyquist curves for NGO electrodes. C) Specific capacitance versus the cycle number of NGO measured at a current density of 0.5 A g−1 within an operational window of 0.0–1 V (the inset shows the charge‐discharge curves of the last few cycles for NGO). D) Ragone plots of NGO‐based supercapacitors. Reproduced with permission.[ 174 ] Copyright 2013, Royal Society of Chemistry.
