
Figure 19.
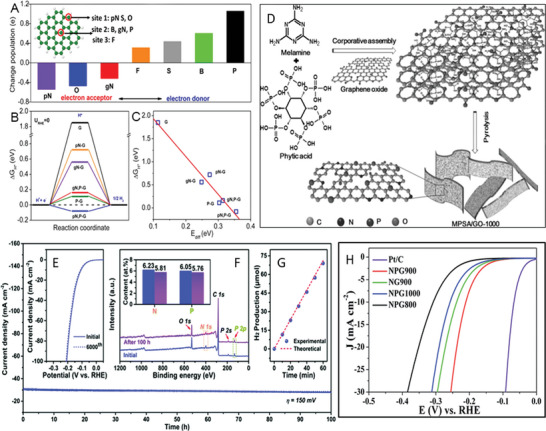
A) NBO population analysis of six different non‐metallic heteroatoms in graphene matrix. pN and gN represent pyridinic and graphitic type of N, respectively. Inset shows the proposed doping sites for different elements, sites 1 and 2 are the edge and center in‐plane sites, respectively, and site 3 is an out‐of‐plane center site in graphene. B) The calculated free energy (ΔG H*) diagram for HER at the equilibrium potential (U RHE = 0 V) for N‐ and/or P‐doped graphene models. C) Relationship between ΔG H* and E diff for various models. Reproduced with permission.[ 475 ] Copyright 2014, American Chemical Society. D) Schematic of the cooperative self‐assembly and pyrolysis process for the synthesis of N, P doped GO. Reproduced with permission.[ 482 ] Copyright 2015, Wiley‐VCH. E) iR‐compensated time dependence of the current density for G‐12NP in 0.5 m H2SO4 for 100 h (η = 150 mV). The inset images are iR‐compensated HER polarization data for G‐12NP in 0.5 m H2SO4 initially and after 6000 CV sweeps between −0.1 and −0.6 V (vs RHE). F) Survey XPS spectra of G‐12NP initially and after 100 h durability tests and the corresponding atomic percentages of N and P. G) Faradaic efficiency of G‐12NP in 0.5 M H2SO4 (η = 150 mV). Reproduced with permission.[ 483 ] Copyright 2019, Royal Society of Chemistry. H) HER polarization curves for various N, P doped graphene as compared to Pt/C shows that N, P doped graphene at 900 °C gives the lowest overpotential. Reproduced with permission.[ 484 ] Copyright 2015, Royal Society of Chemistry.