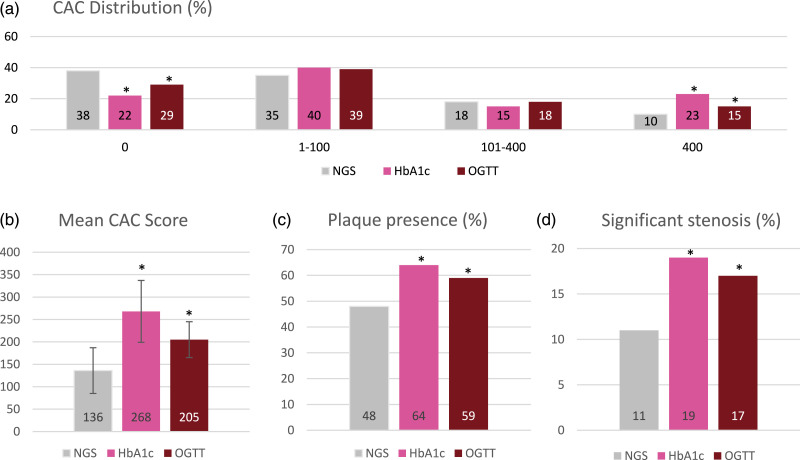
Figure 3.
(a)–(d): CCTA findings regarding CAC score, plaque- and stenosis presence, and plaque characteristics in patients with normal glycemic status and prediabetes. *p-value <0.05 compared with normal glycemic status (NGS). NGS is shown as the mean value of the two normal groups. To compare the percentages of CAC-groups χ2 for qualitative variables was used. CAC, Coronary Artery Calcium; OGTT, Oral Glucose Tolerance Test; HbA1c, HemoglobinA1c.

