Figure 4.
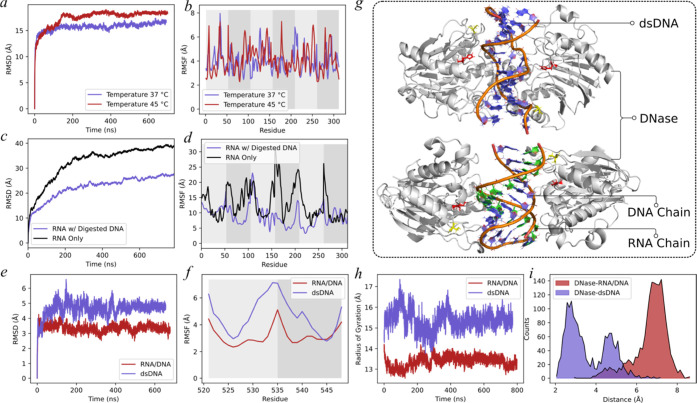
Molecular dynamics simulation results. (a, b) Root-mean-square deviation (RMSD) and root-mean-square fluctuation (RMSF) analyses of the RNA cube structure under 37 and 45 °C. (c, d) RMSD and RMSF analyses of the RNA-only structure and the RNA with the digested DNA structure. The striped shading of the background in panels (b) and (d) indicates different RNA chains. (e, f) RMSD and RMSF analyses of the DNase/RNA/DNA complex and the DNase/dsDNA complex. The striped shading of the background in panel (f) indicates different RNA and DNA chains. (g) Centroid structure of the largest cluster from the simulation of the DNase/RNA/DNA complex and the DNase/dsDNA complex. (h) Radius of gyration analysis of the two complexes. (i) Distribution of the distances between the active site (H134) in the DNase and the DNA chains.

