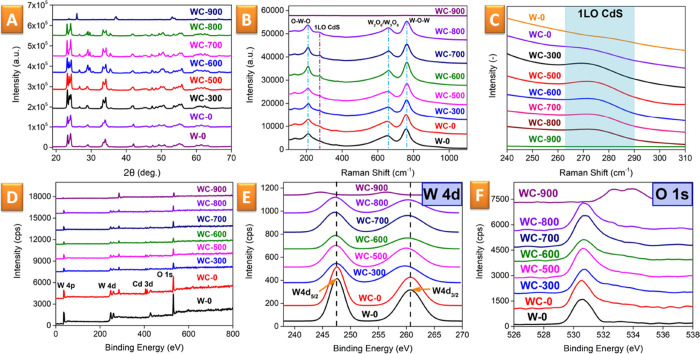
Figure 2.
Evolution of the WO3/CdS: XRD pattern (A) and Raman spectra (B) as a function of the annealing temperature; (C) highlighted Raman spectral area with characteristic signals from the crystalline CdS phase as a function of the annealing temperature; (D) raw XPS spectra of pristine and annealed samples; and (E, F) details of characteristic W 4d3/2 XPS and O 1s peaks.

