
Figure 3.
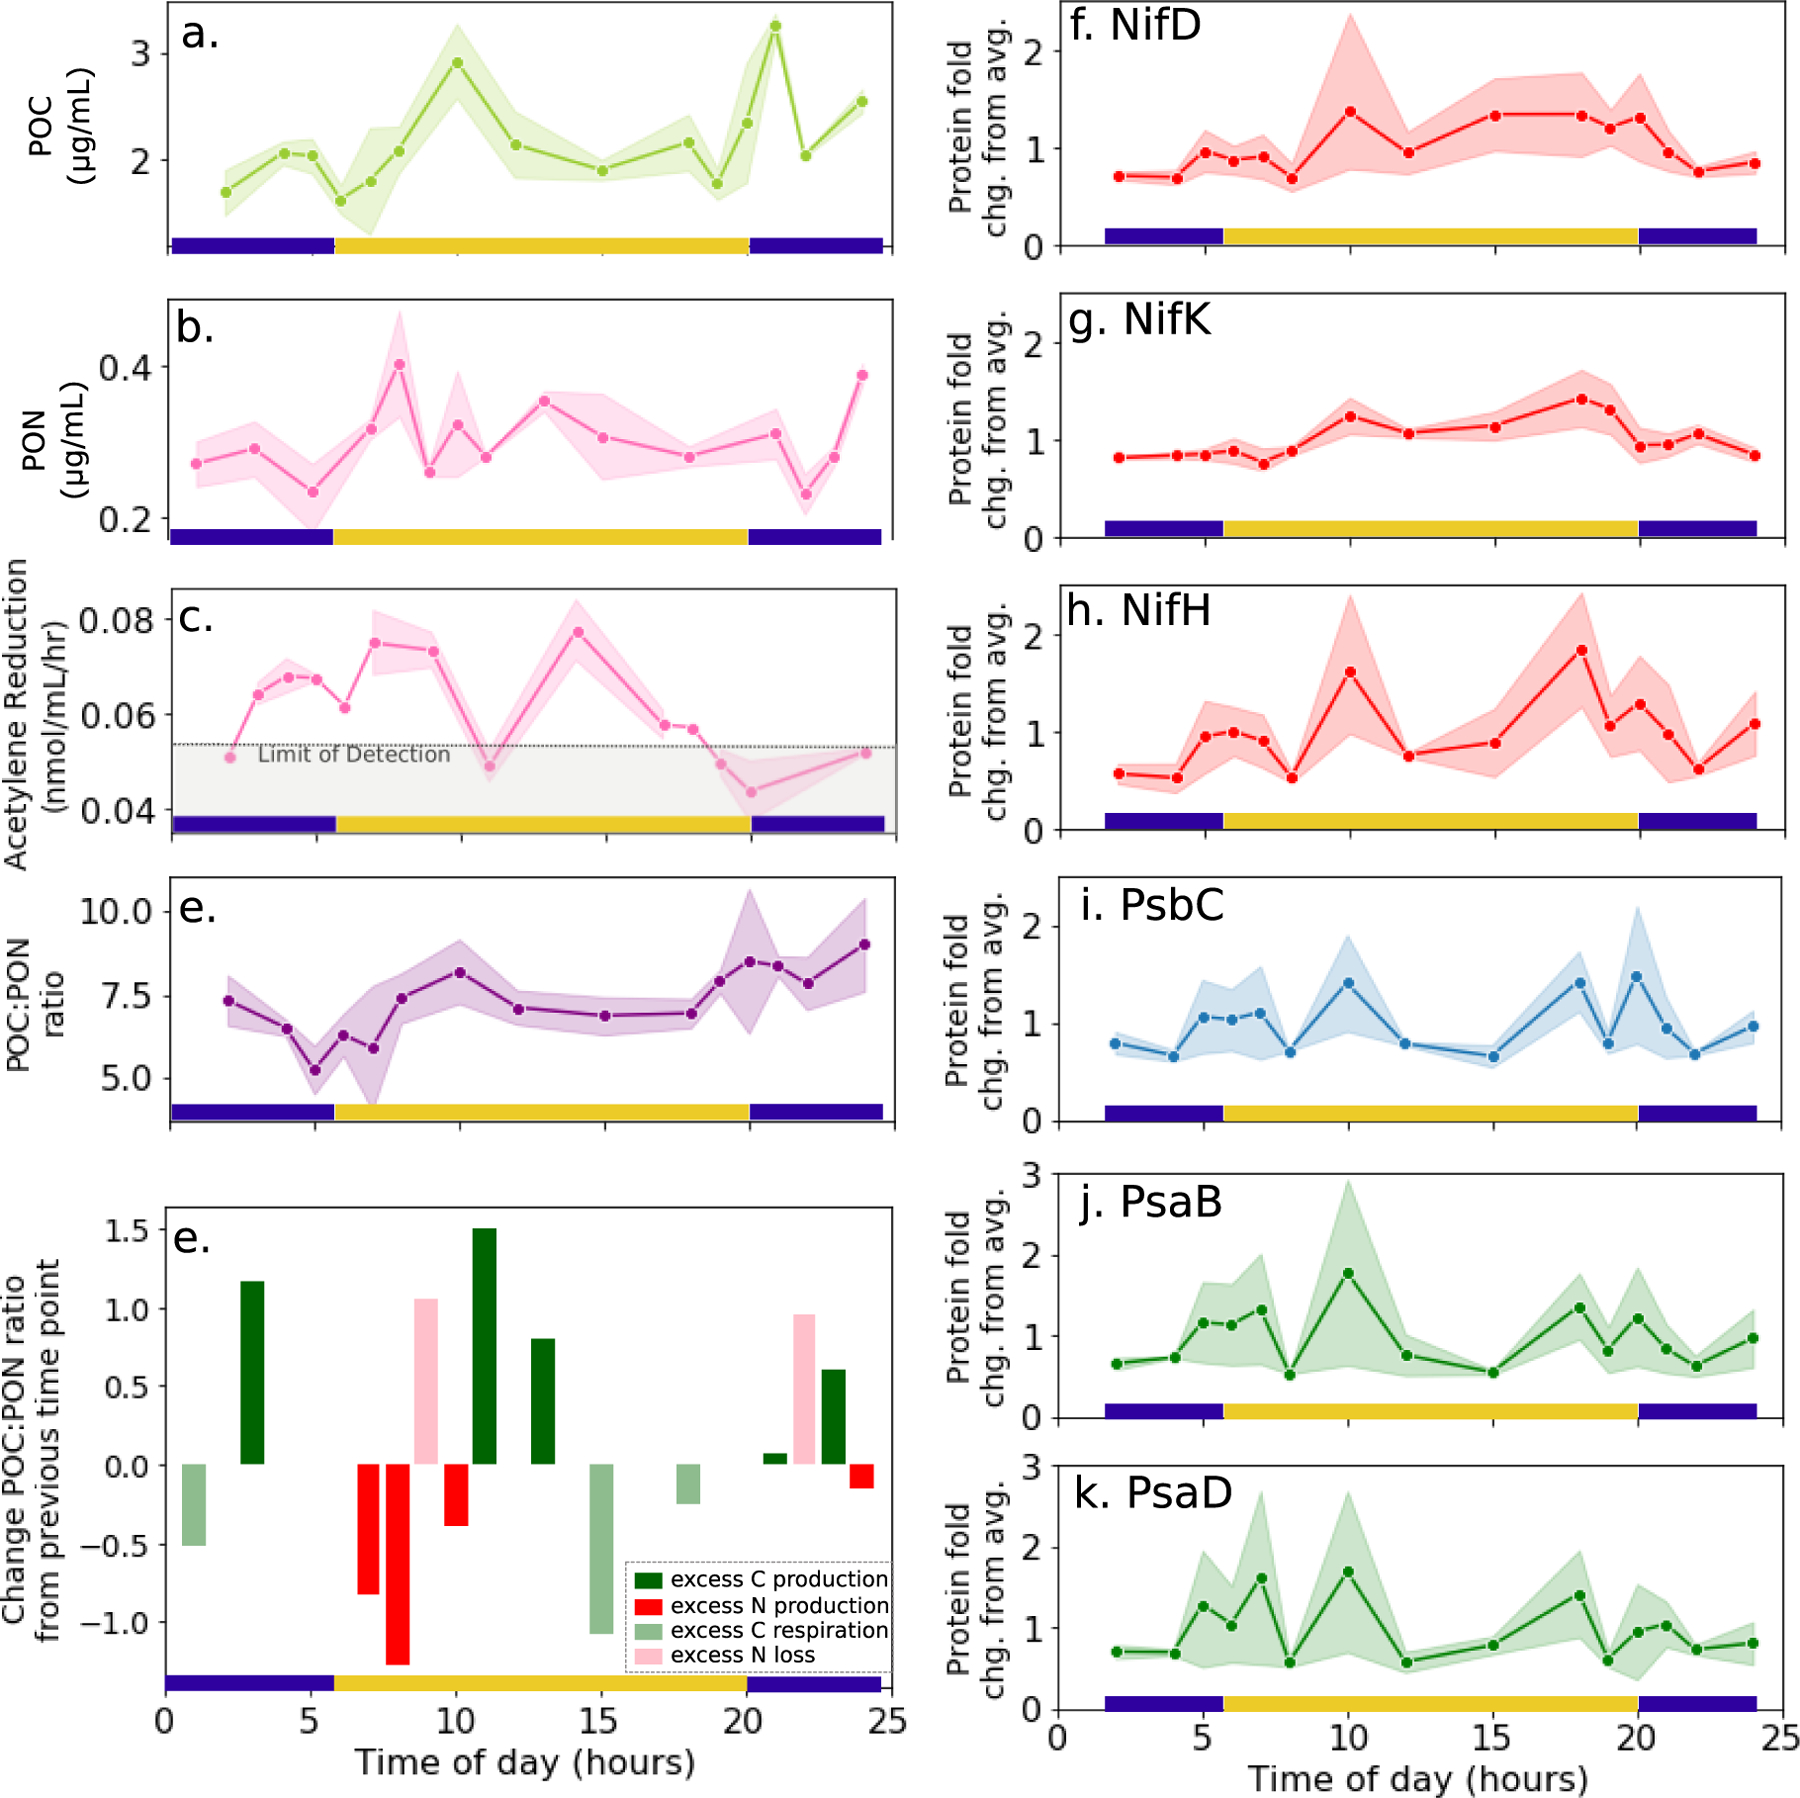
Temporal dynamics of a. POC, b. PON, c. acetylene reduction rates, and d. the POC:PON ratio in cultured T. erythraeum over the diel cycle. e. Temporal changes in the POC:PON ratio relative to previous time point, with bars color coded based on associated changes in either POC or PON content, with the possible processes being excess C production, excess N production, excess C respiration, or excess N loss (see text). On the right, associated temporal changes in the abundance of the three nitrogenase subunits (f-h), photosystem I protein PsbC (i) and photosystem II proteins PsaB and PsaD (j-k). Each scatter point represents the average value across the biological triplicates, and shaded areas represent 90% confidence intervals for the replicates calculated by bootstrapping (n=1000). Protein abundances are normalized to their average value across the entire diel cycle.