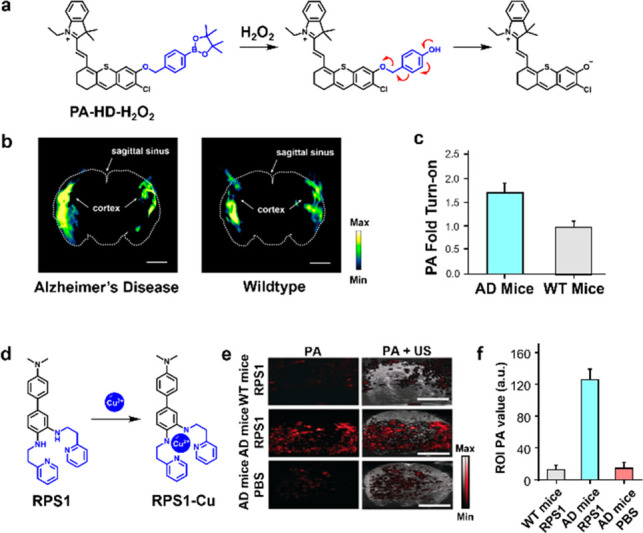
Figure 1.

(a) Schematic of the reaction between PA-HD-H2O2 and H2O2 to afford PA-HD. (b) Spectrally unmixed PA images of AD and WT brain. Sagittal sinus and cortex indicated by arrows. (c) Quantified data from (b). (d) Schematic of reaction between RPS1 and Cu(II). (e) PA (left) and PA and ultrasound (right) images of WT mice and AD mice treated with RPS1 (top and middle rows, respectively), and AD mice administered a PBS vehicle control. (f) Quantified data from (e). Adapted with permission from refs (12) and (14). Copyright 2021 and 2019 Wiley.
