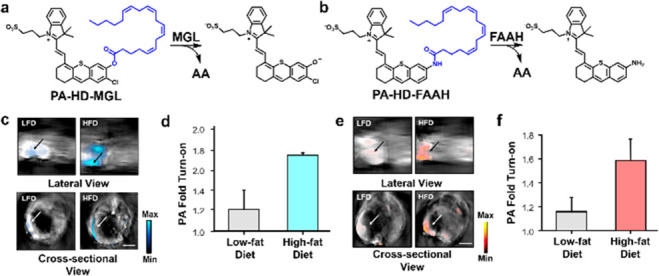
Figure 7.

(a) Structure of PA-HD-MGL and (b) PA-HD-FAAH and their turnover products. (c) Representative lateral and cross-sectional PA images and (d) PA fold turn-on between low-fat diet (LFD) and high-fat diet (HFD) mice for PA-HD-MGL. (e) Representative lateral and cross-sectional PA images and (f) PA fold turn-on between LFD and HFD mice for PA-HD-FAAH. Adapted with permission from ref (34). Copyright 2022 Wiley.
