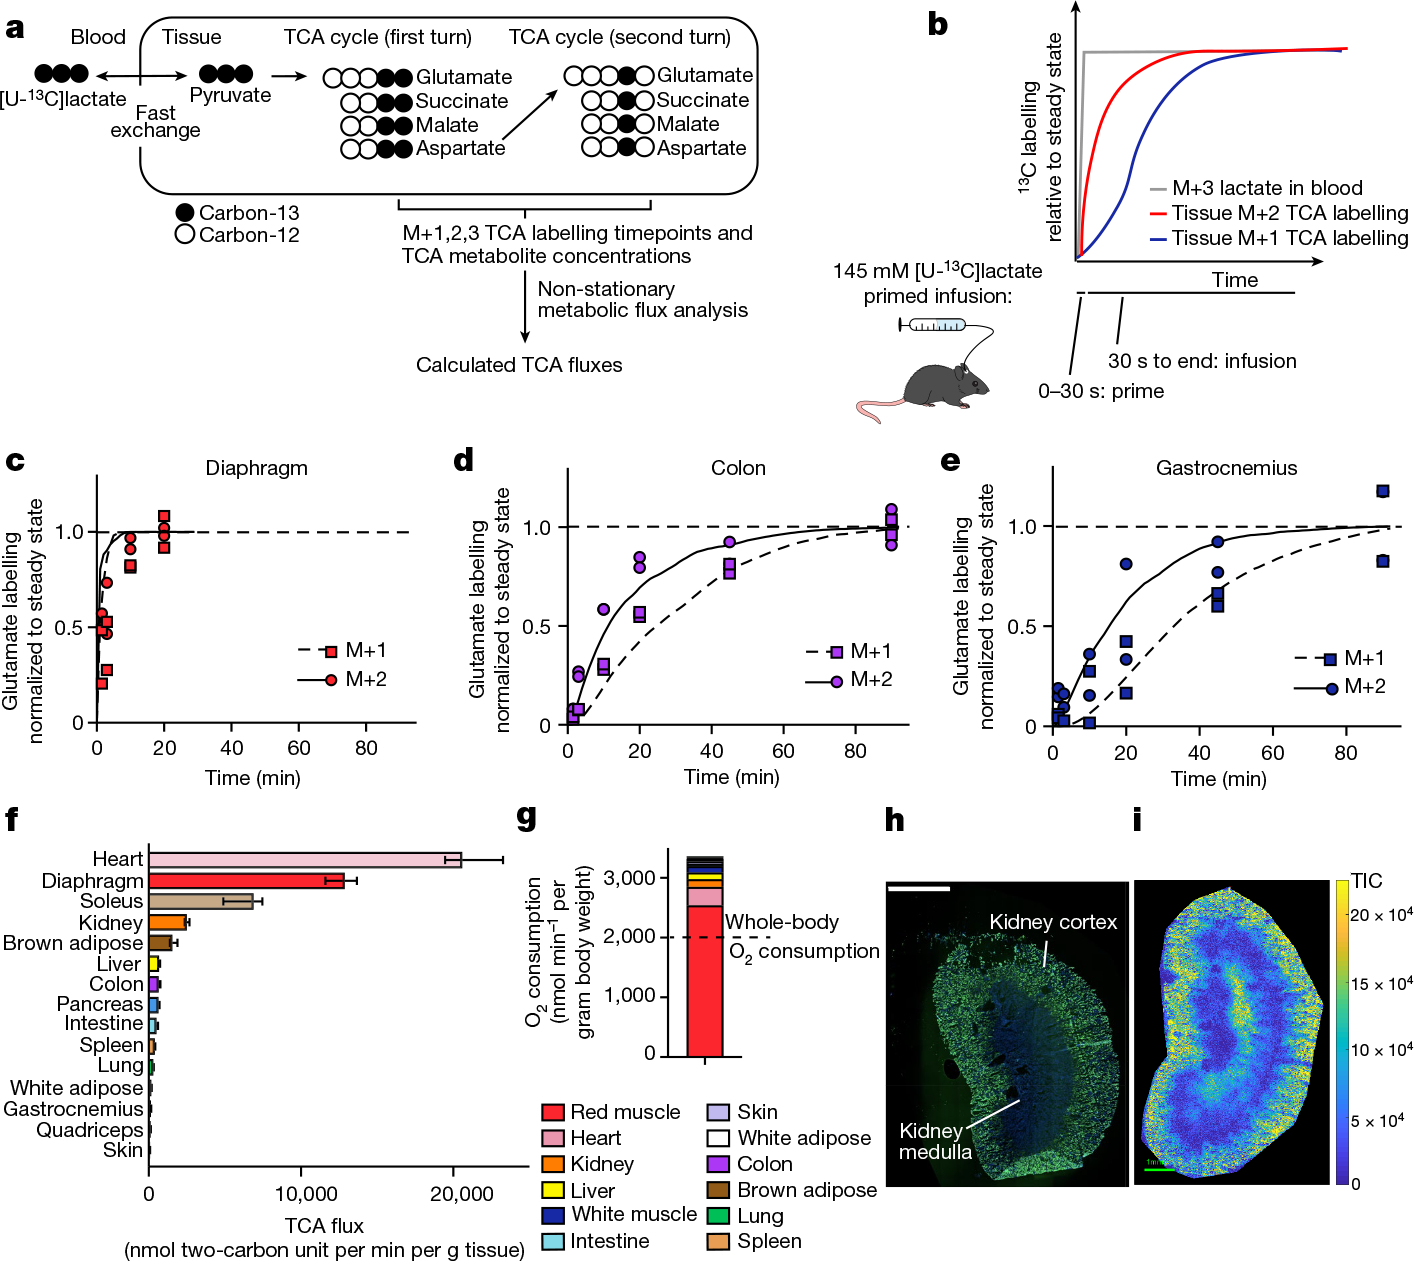
Fig. 1 |. In vivo measurement of TCA flux by kinetic [U-13C]lactate infusion.

a, Schematic of carbon labelling of TCA metabolites resulting from a [U-13C] lactate infusion. b, Schematic of the kinetics of blood lactate and tissue TCA metabolite labelling from a [U-13C]lactate primed infusion. c, Labelling of diaphragm glutamate M+2 and M+1 using a [U-13C]lactate-primed infusion, normalized to steady-state labelling. d, Labelling of colon glutamate M+2 and M+1 using a [U-13C]lactate primed infusion, normalized to steady-state labelling (that is, final timepoint measured). e, Labelling of gastrocnemius muscle glutamate M+2 and M+1 using a [U-13C]lactate-primed infusion, normalized to steady-state labelling. For c–e, n = 12 mice in each panel, two mice per timepoint, 6 timepoints. f, Tissue TCA fluxes. Data are best estimate of flux from computational modeling ± s.d. of the model fits. Fluxes were calculated for the primed infusion timepoints in n = 12 mice per tissue (except n = 19 for brown adipose and intestine, and n = 17 for soleus) and tissue metabolite concentrations measured in n = 4 mice for each tissue (except n = 3 for diaphragm). g, Oxygen consumption by each tissue calculated from tissue mass and TCA flux. The dotted line is the whole-body oxygen consumption measured using a metabolic cage. h, Immunofluorescence staining of the kidney proximal tubule using lotus tetragonolobus lectin. Scale bar, 2 mm. i, IMS analysis of glutamate M+2 labelling after 90 s [U-13C]lactate-primed infusion. Scale bar, 1 mm; labeling intensity in TIC, total ion counts. The experiments in h and i were performed on serial tissue slices; data are representative of n = 2 mice.
