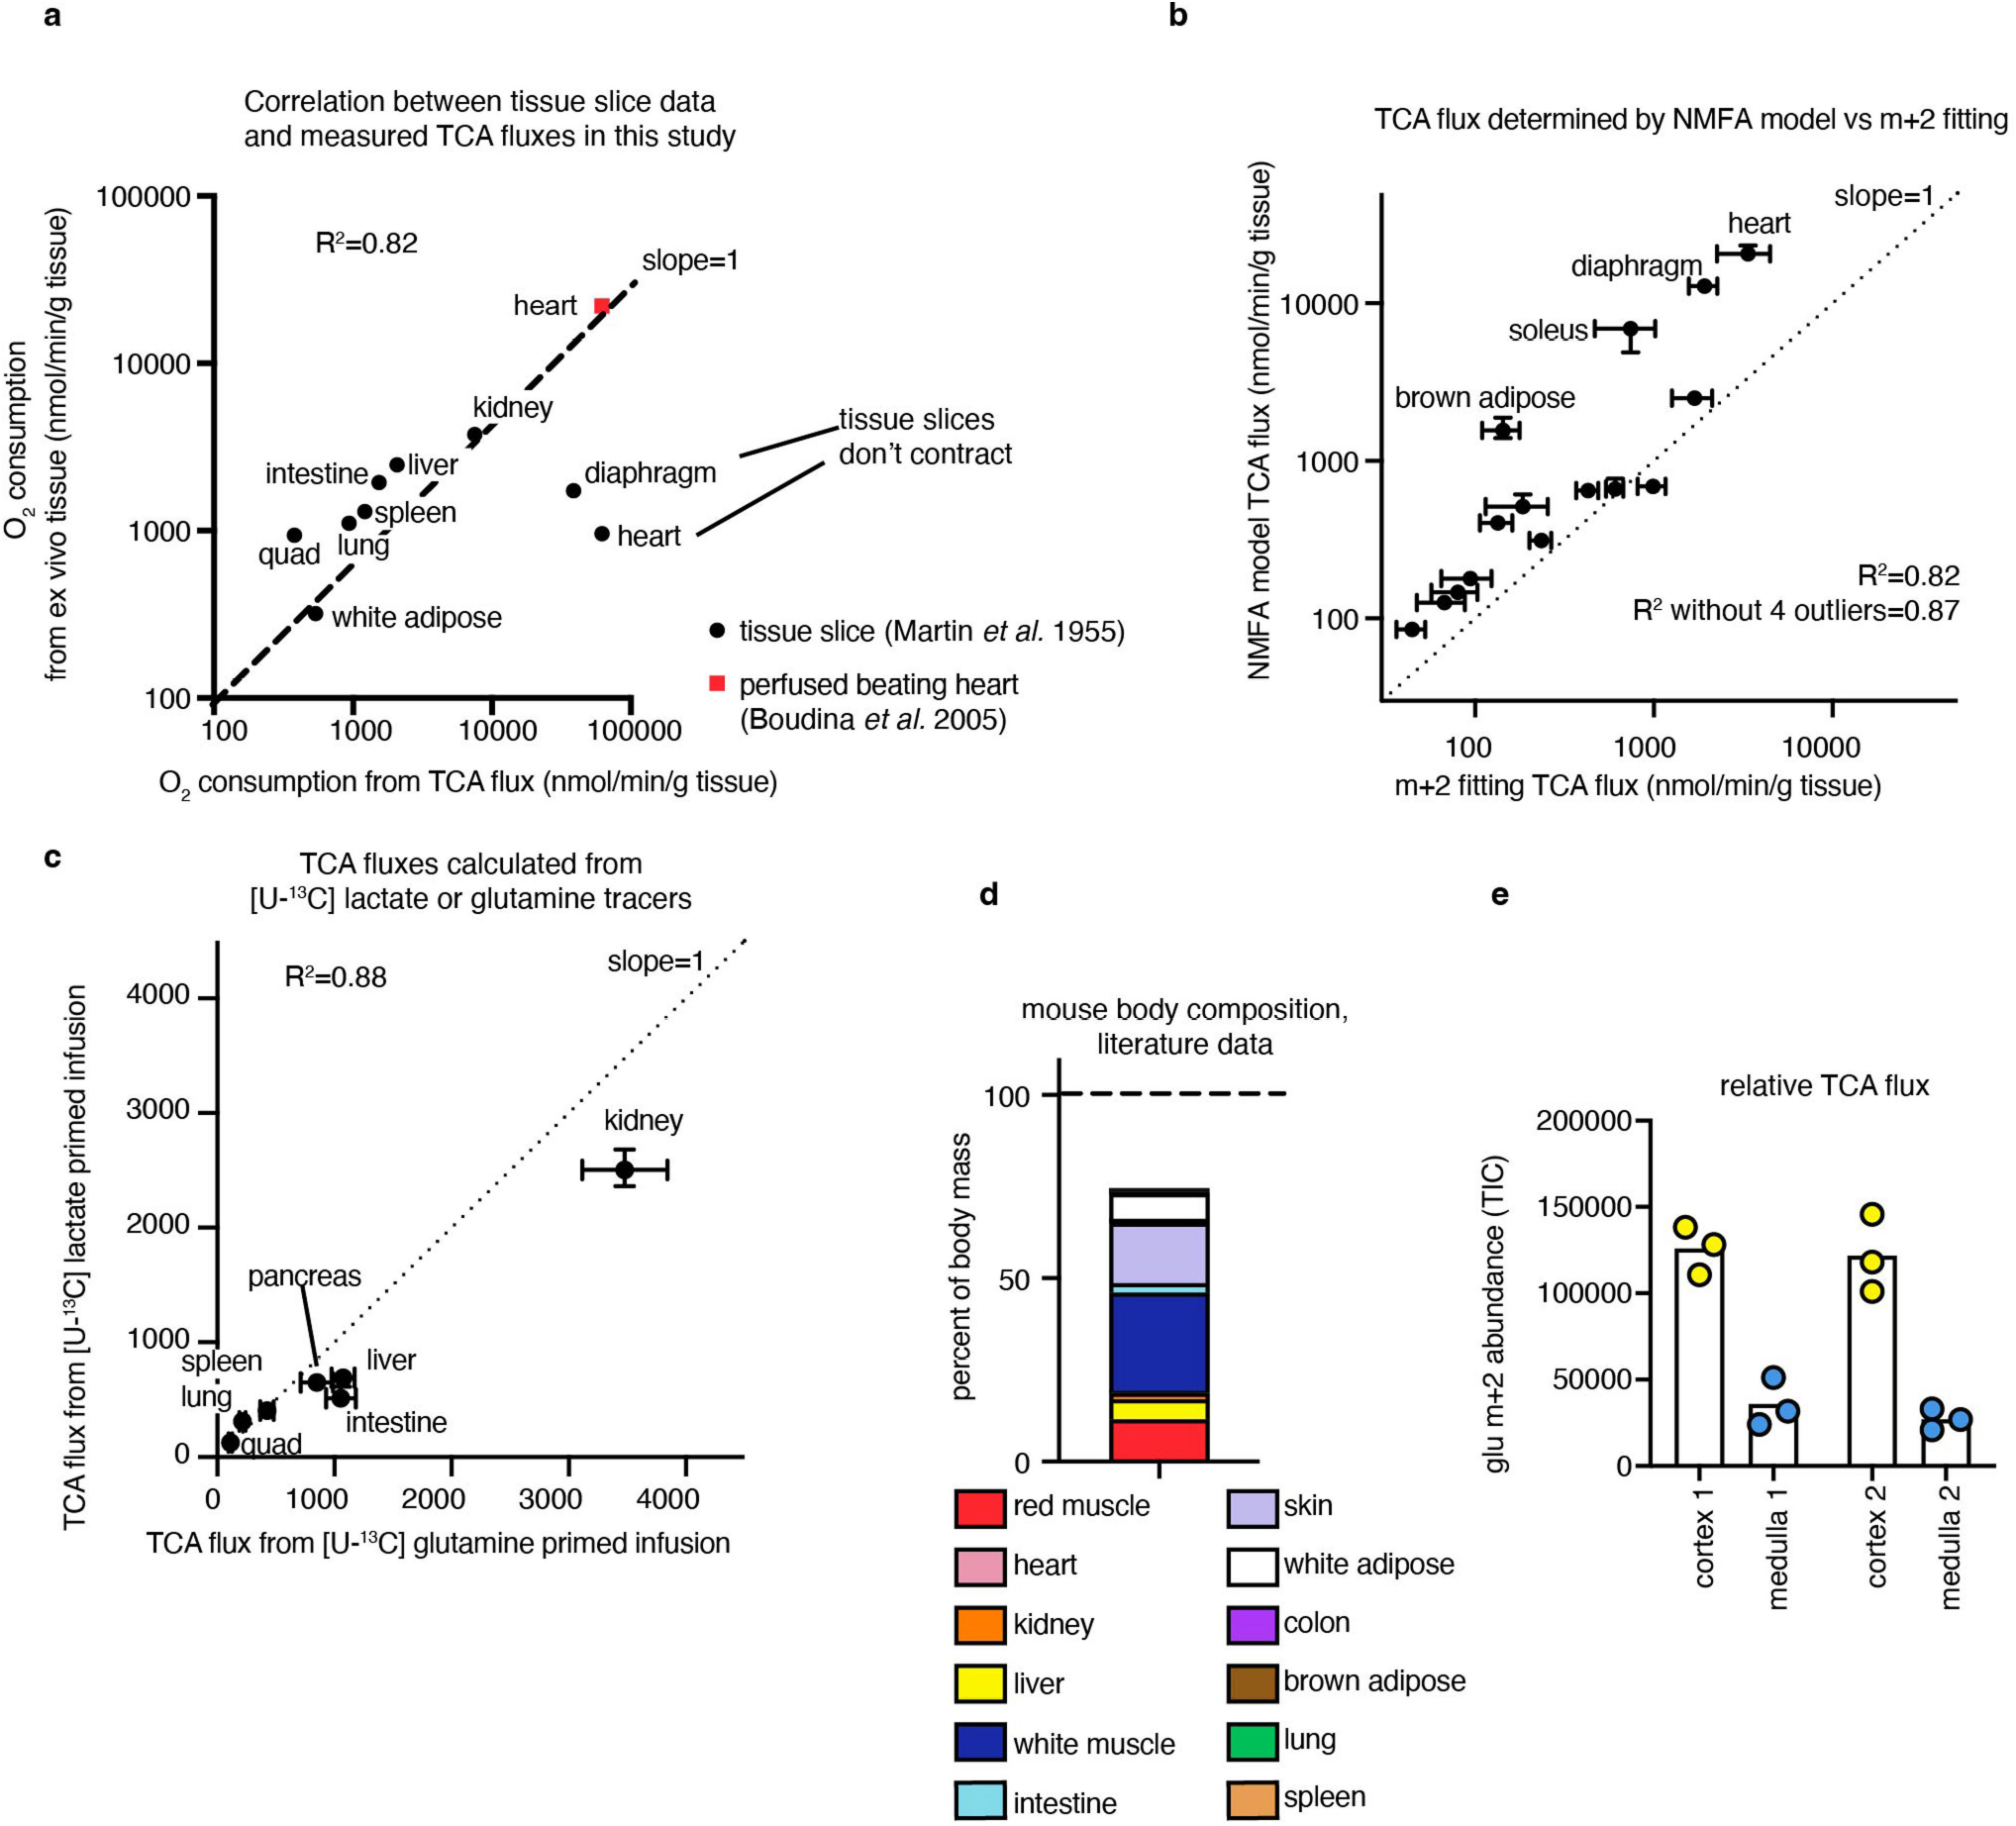
Extended Data Fig. 4 |. Healthy tissue TCA fluxes.

(a) Oxygen consumption calculated from TCA fluxes measured in this study correlates well to literature tissue slice oxygen consumption data (Martin & Fuhrmann, Phys Zool 1955), except for diaphragm and heart; heart correlates better to ex vivo beating heart oxygen consumption data from Boudina et al., Circulation 2005 (n = 12 mice per tissue for [U-13C] lactate infusion timepoints except n = 19 for brown adipose, n = 19 for intestine, n = 17 for soleus; n = 4 mice to measure tissue metabolite concentrations except n = 3 for diaphragm). (b) TCA fluxes calculated by non-stationary metabolic flux analysis (NMFA) model versus multiplying m+2 TCA metabolite labelling speed with summed TCA metabolite concentration are similar, except for heart, soleus, diaphragm, and brown adipose (n = 12 mice per tissue for [U-13C] lactate infusion timepoints except n = 19 for brown adipose, n = 19 for intestine, n = 17 for soleus; n = 4 mice to measure tissue metabolite concentrations except n = 3 for diaphragm). (c) TCA fluxes calculated using NMFA model from [U-13C] lactate infusion data or [U-13C] glutamine infusion data are similar (n = 12 mice per tissue for lactate primed infusion timepoints, n = 10 mice per tissue for glutamine primed infusion timepoints, n = 4 mice per tissue to measure tissue metabolite concentrations). (d) Mouse tissues as a percent of body mass (Brown et al., Toxicol Ind Health 1997). (e) Relative TCA flux in kidney cortex and medulla, measured using glutamate m+2 abundance after 1.5 min [U-13C] lactate primed infusion using imaging mass spectrometry, n = 2 mice, each point is a measurement in a distinct region in one of the images (showing 3 points per image per region). Error bars show median +/− standard deviation.
