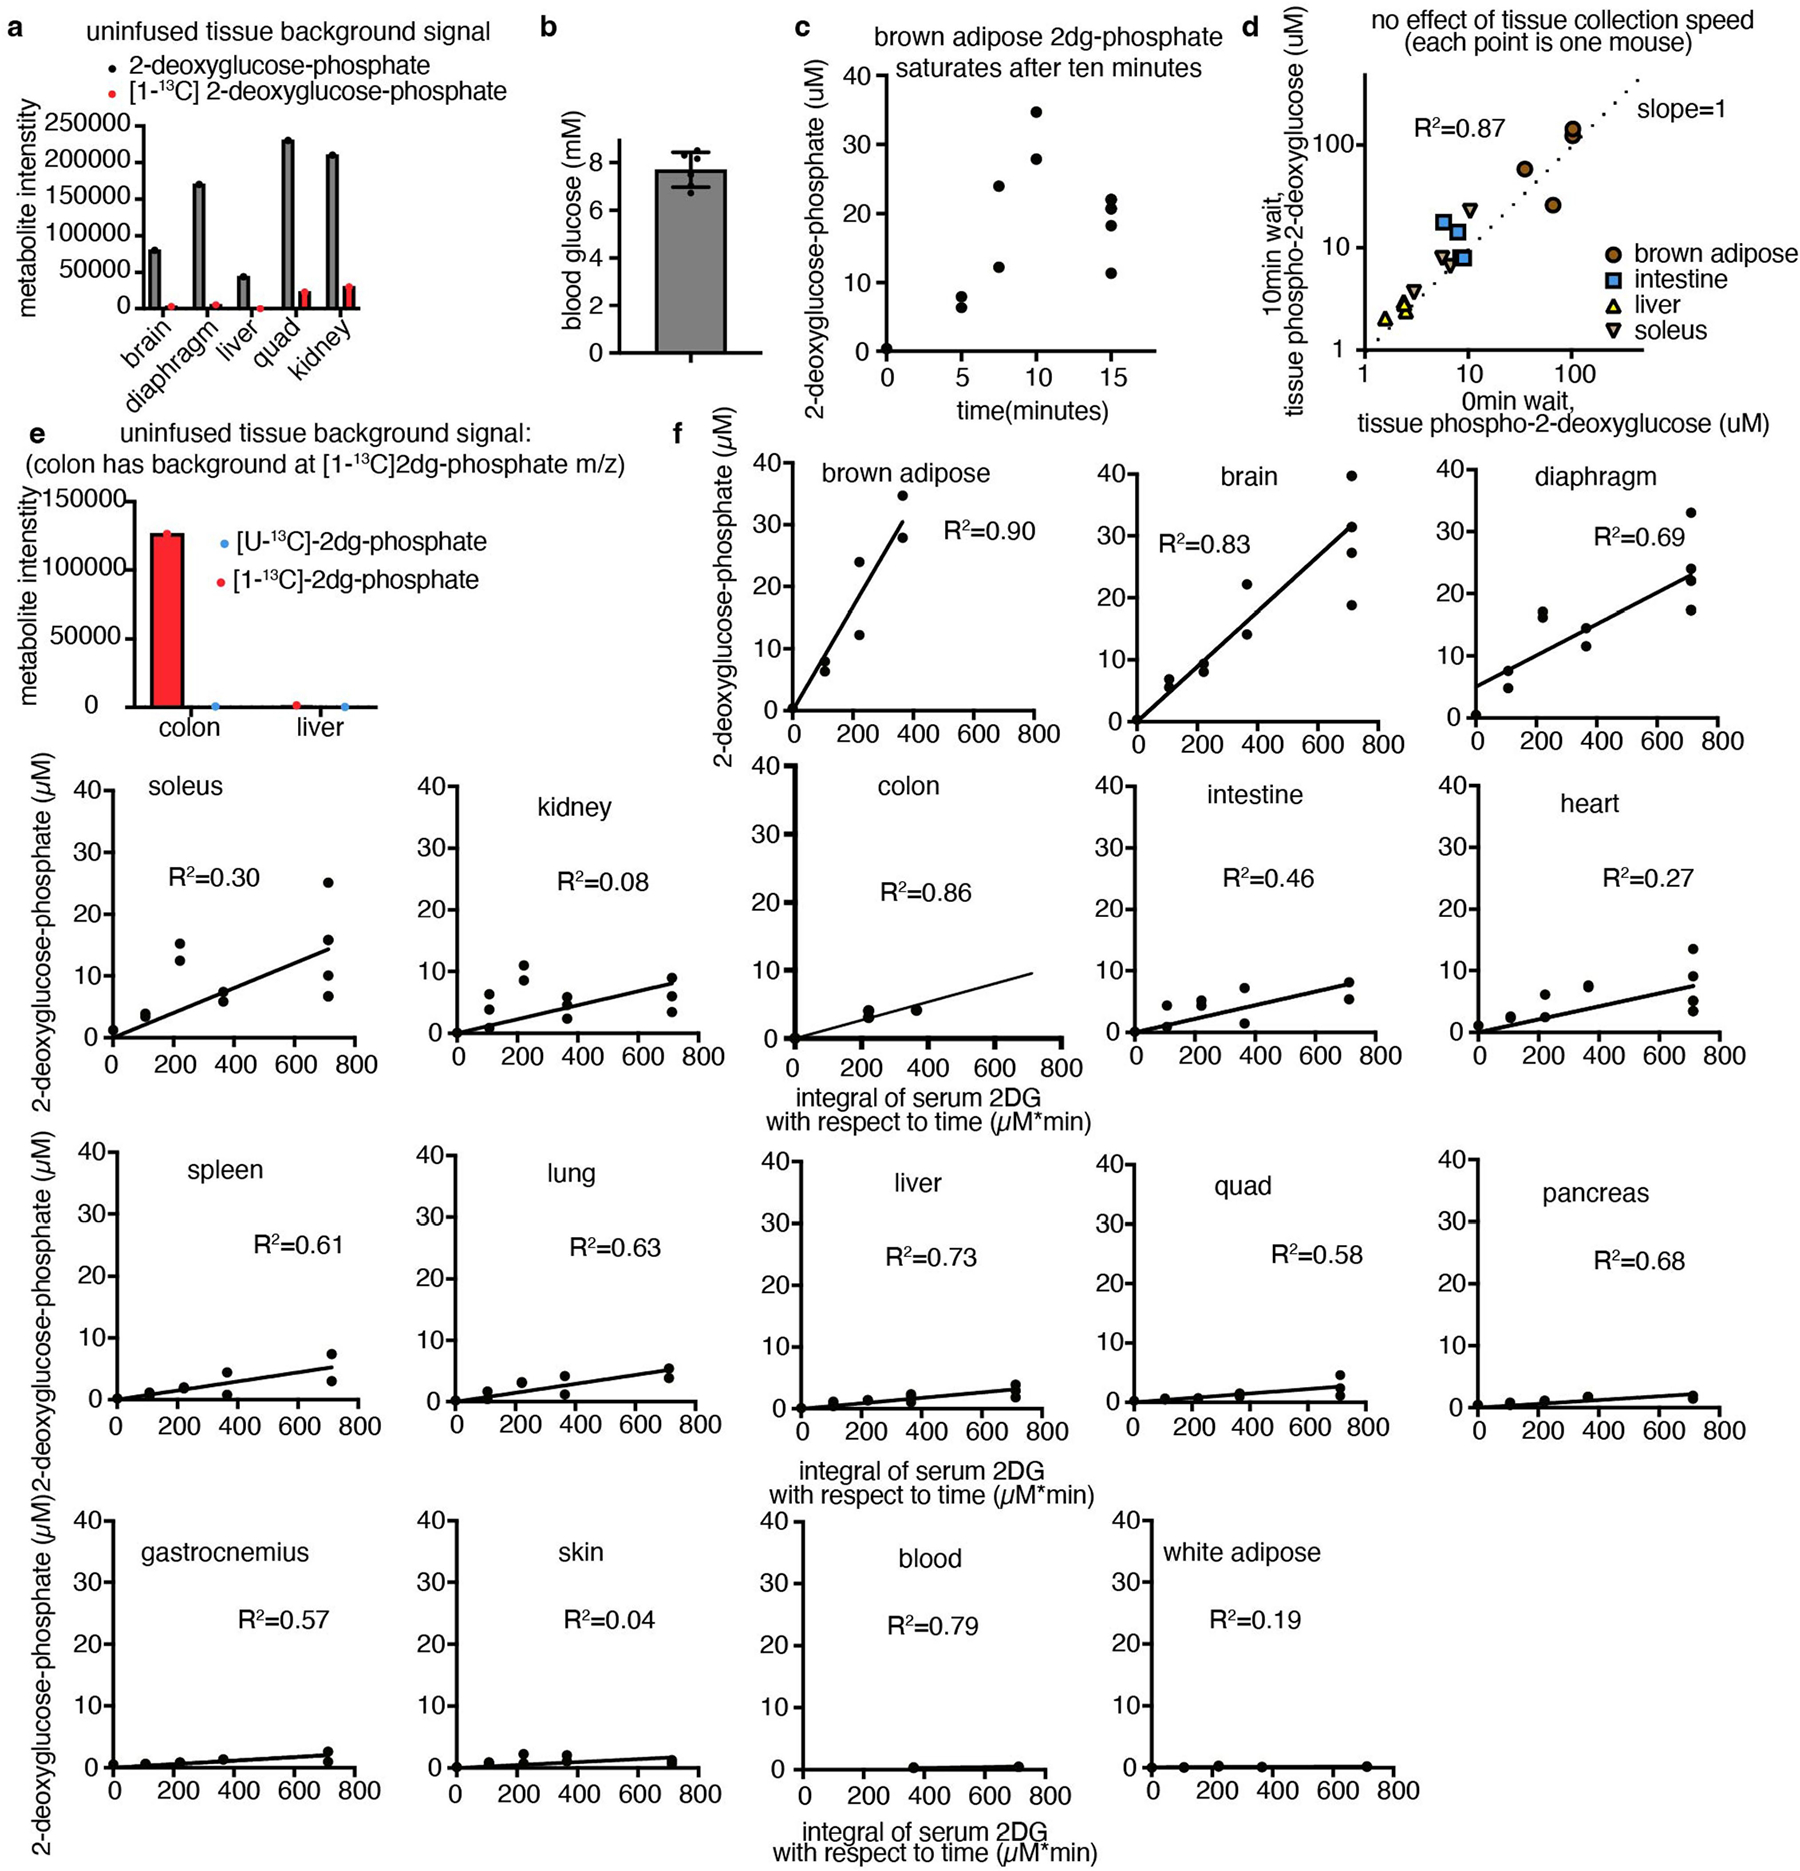
Extended Data Fig. 5 |. Kinetic 2-deoxyglucose infusion.

(a) The m/z of [1-13C] 2-deoxyglucose-phosphate has lower background signal in uninfused tissues compared to the m/z of unlabelled carbon-12 2-deoxyglucose-phosphate, n = 1 mouse shown, representative of n = 4 mice. (b) Arterial blood glucose concentration, n = 6 mice, error bar shows mean +/− standard deviation. (c) Brown adipose [1-13C] 2-deoxyglucose-phosphate concentration saturates after 10 min of [1-13C] 2-deoxyglucose infusion; therefore later timepoints were discarded in calculating glucose usage flux, n = 13 mice. (d) Waiting ten minutes after euthanasia to harvest tissues does not alter 2-deoxyglucose-phosphate concentrations after 10 min [1-13C] 2-deoxyglucose infusion, n = 4 mice per tissue per collection time, each point represents a pair of tissues from a single mouse (x and y axis values). (e) Colon and not liver (or other tissues) has a substantial background peak at the m/z of [1-13C] 2-deoxyglucose-phosphate (n = 1 mouse shown, representative of n = 13 mice); to measure glucose usage in this tissue, [U-13C] 2-deoxyglucose infusion was used. (f) [1-13C] or [U-13C] 2-deoxyglucose-phosphate concentrations in tissues at different timepoints after start of infusion (all infused with [1-13C] 2-deoxyglucose, except [U-13C] 2-deoxyglucose for colon); slope of line is the glucose usage flux, calculated from the datapoints, requiring a y-intercept of 0 (n = 4 mice for colon and blood; n = 9 mice for gastrocnemius, intestine, lung, pancreas, skin, spleen, white adipose; n = 12 mice for kidney, liver, quad; n = 13 for brain, brown adipose, diaphragm, heart, soleus).
