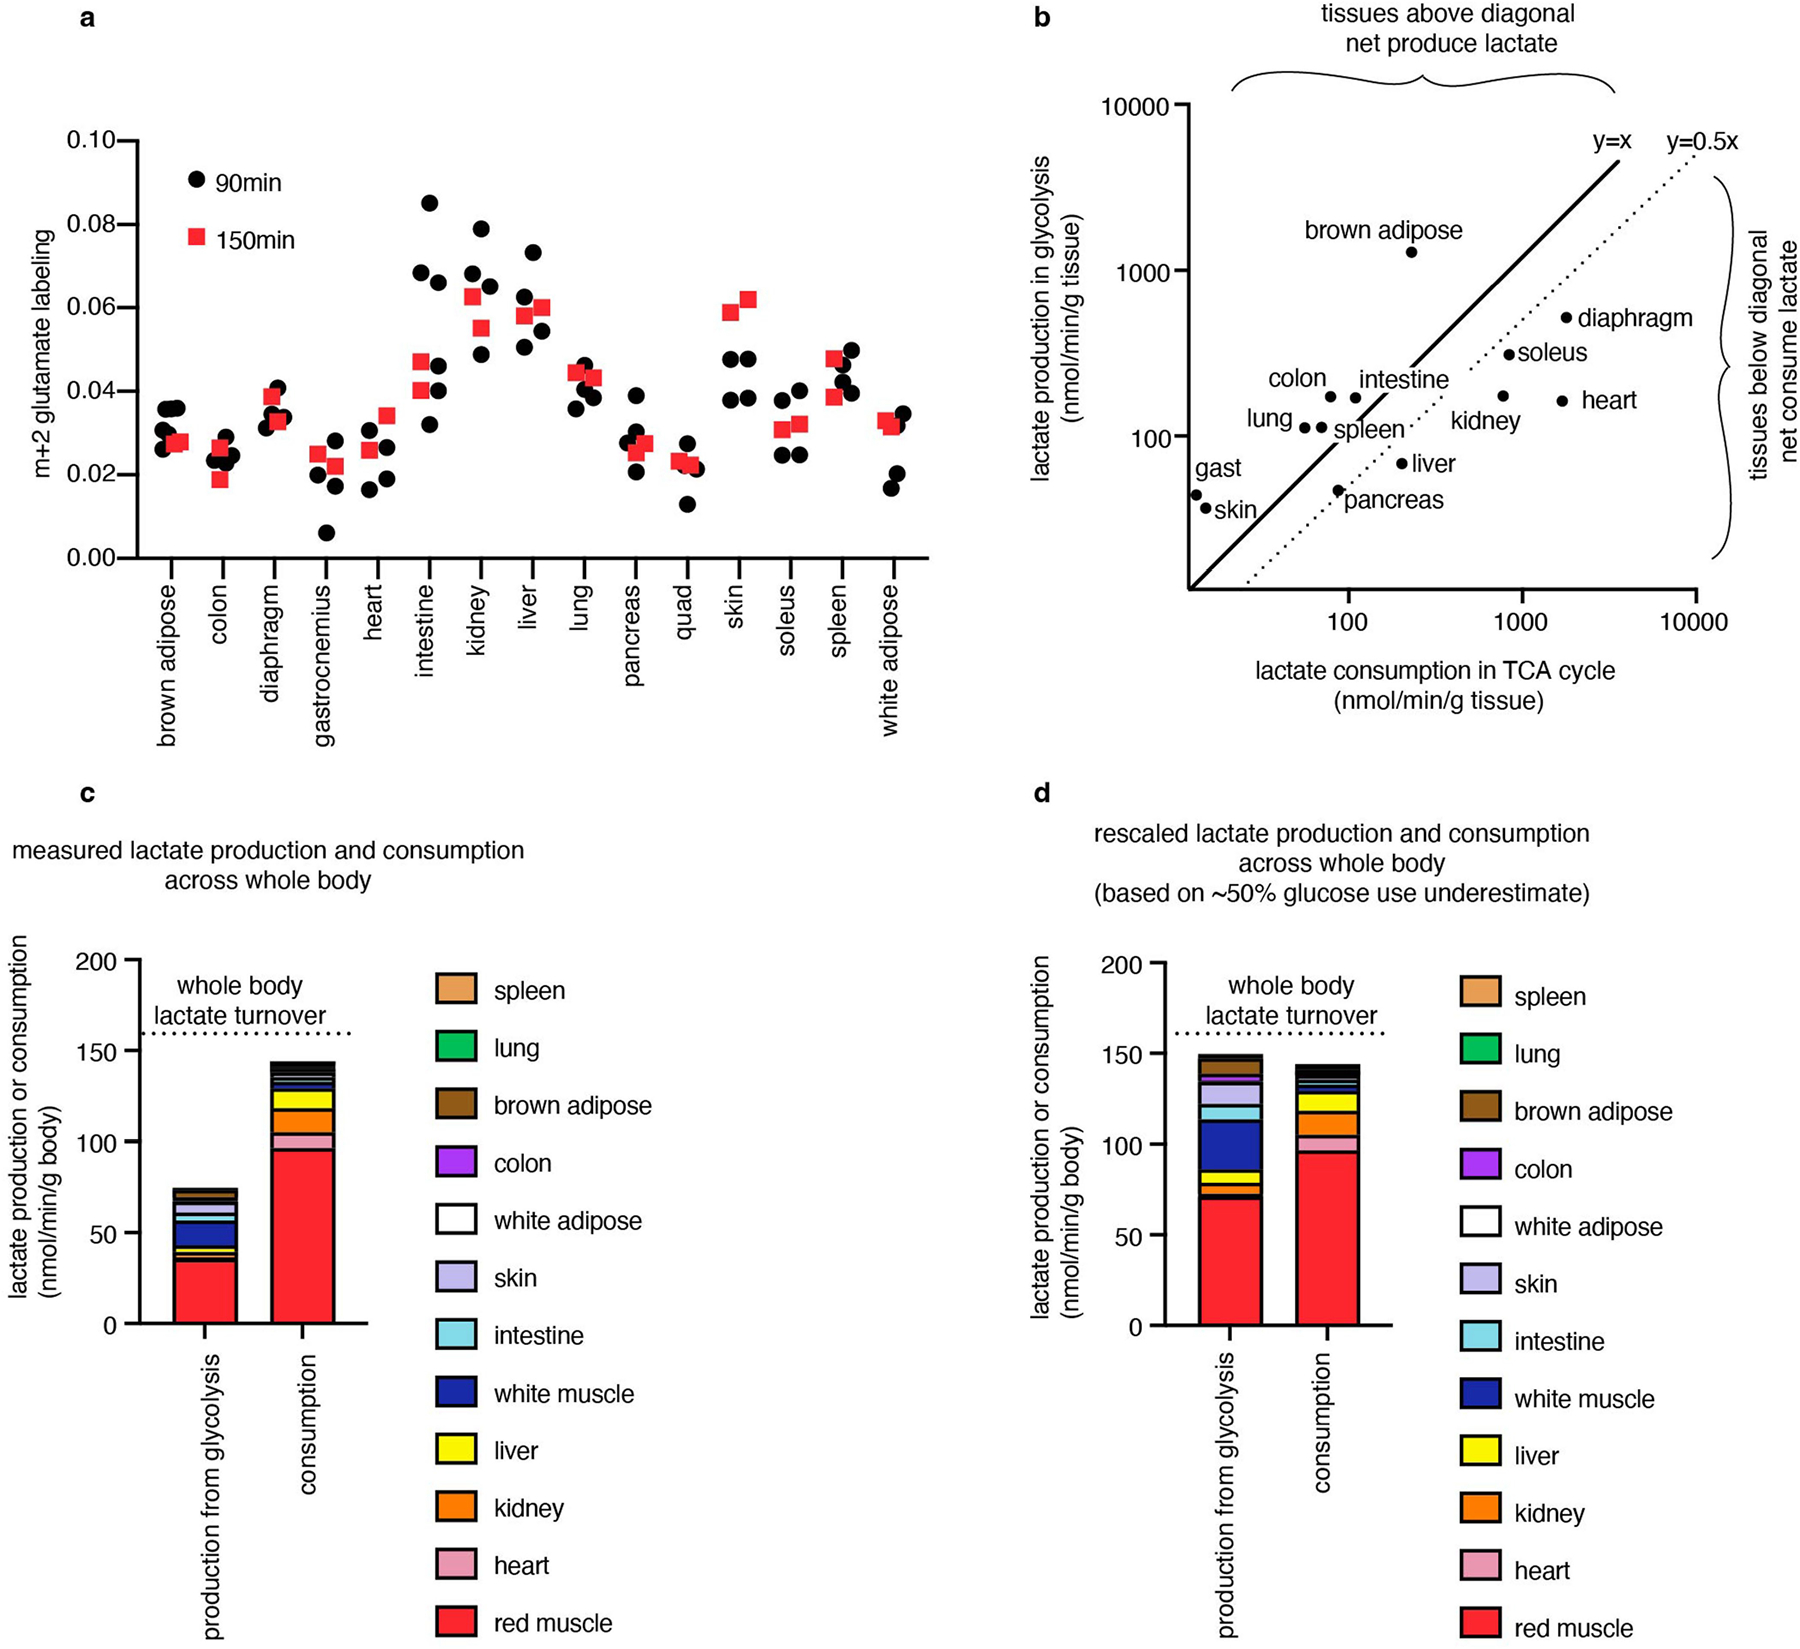
Extended Data Fig. 6 |. Calculated tissue lactate consumption and production.

(a) Non-normalized labelling of m+2 glutamate from primed [U-13C] lactate infusion after 90 min (n = 4 mice for each tissue except n = 6 for brown adipose and intestine) or 150 min (n = 2 mice for each tissue). Mean labelling from 90 min was used as pseudo-steady state to normalize labelling in figures, and to calculate tissue lactate consumption from TCA flux values. (b) Production and consumption of lactate by tissues, calculated from glucose usage flux and from TCA flux multiplied by lactate contribution to TCA cycle respectively, showing both y = x line (equal measured lactate production and consumption) and y = 0.5x line (equal production and consumption of lactate if glucose use rate is truly twice as high as we measured). (c) Tissues producing and consuming lactate in the whole body, considering mass of each mouse tissue as a fraction of the whole body. (d) Tissues producing and consuming lactate calculated as in (c) but if true glucose usage is twice as high as we measured. For (b–d), glucose usage fluxes were measured with n = 4–13 mice, TCA fluxes were measured with n = 12 mice to measure kinetic infusion timepoints and n = 4 mice to measure TCA metabolite concentrations (except n = 3 for diaphragm).
