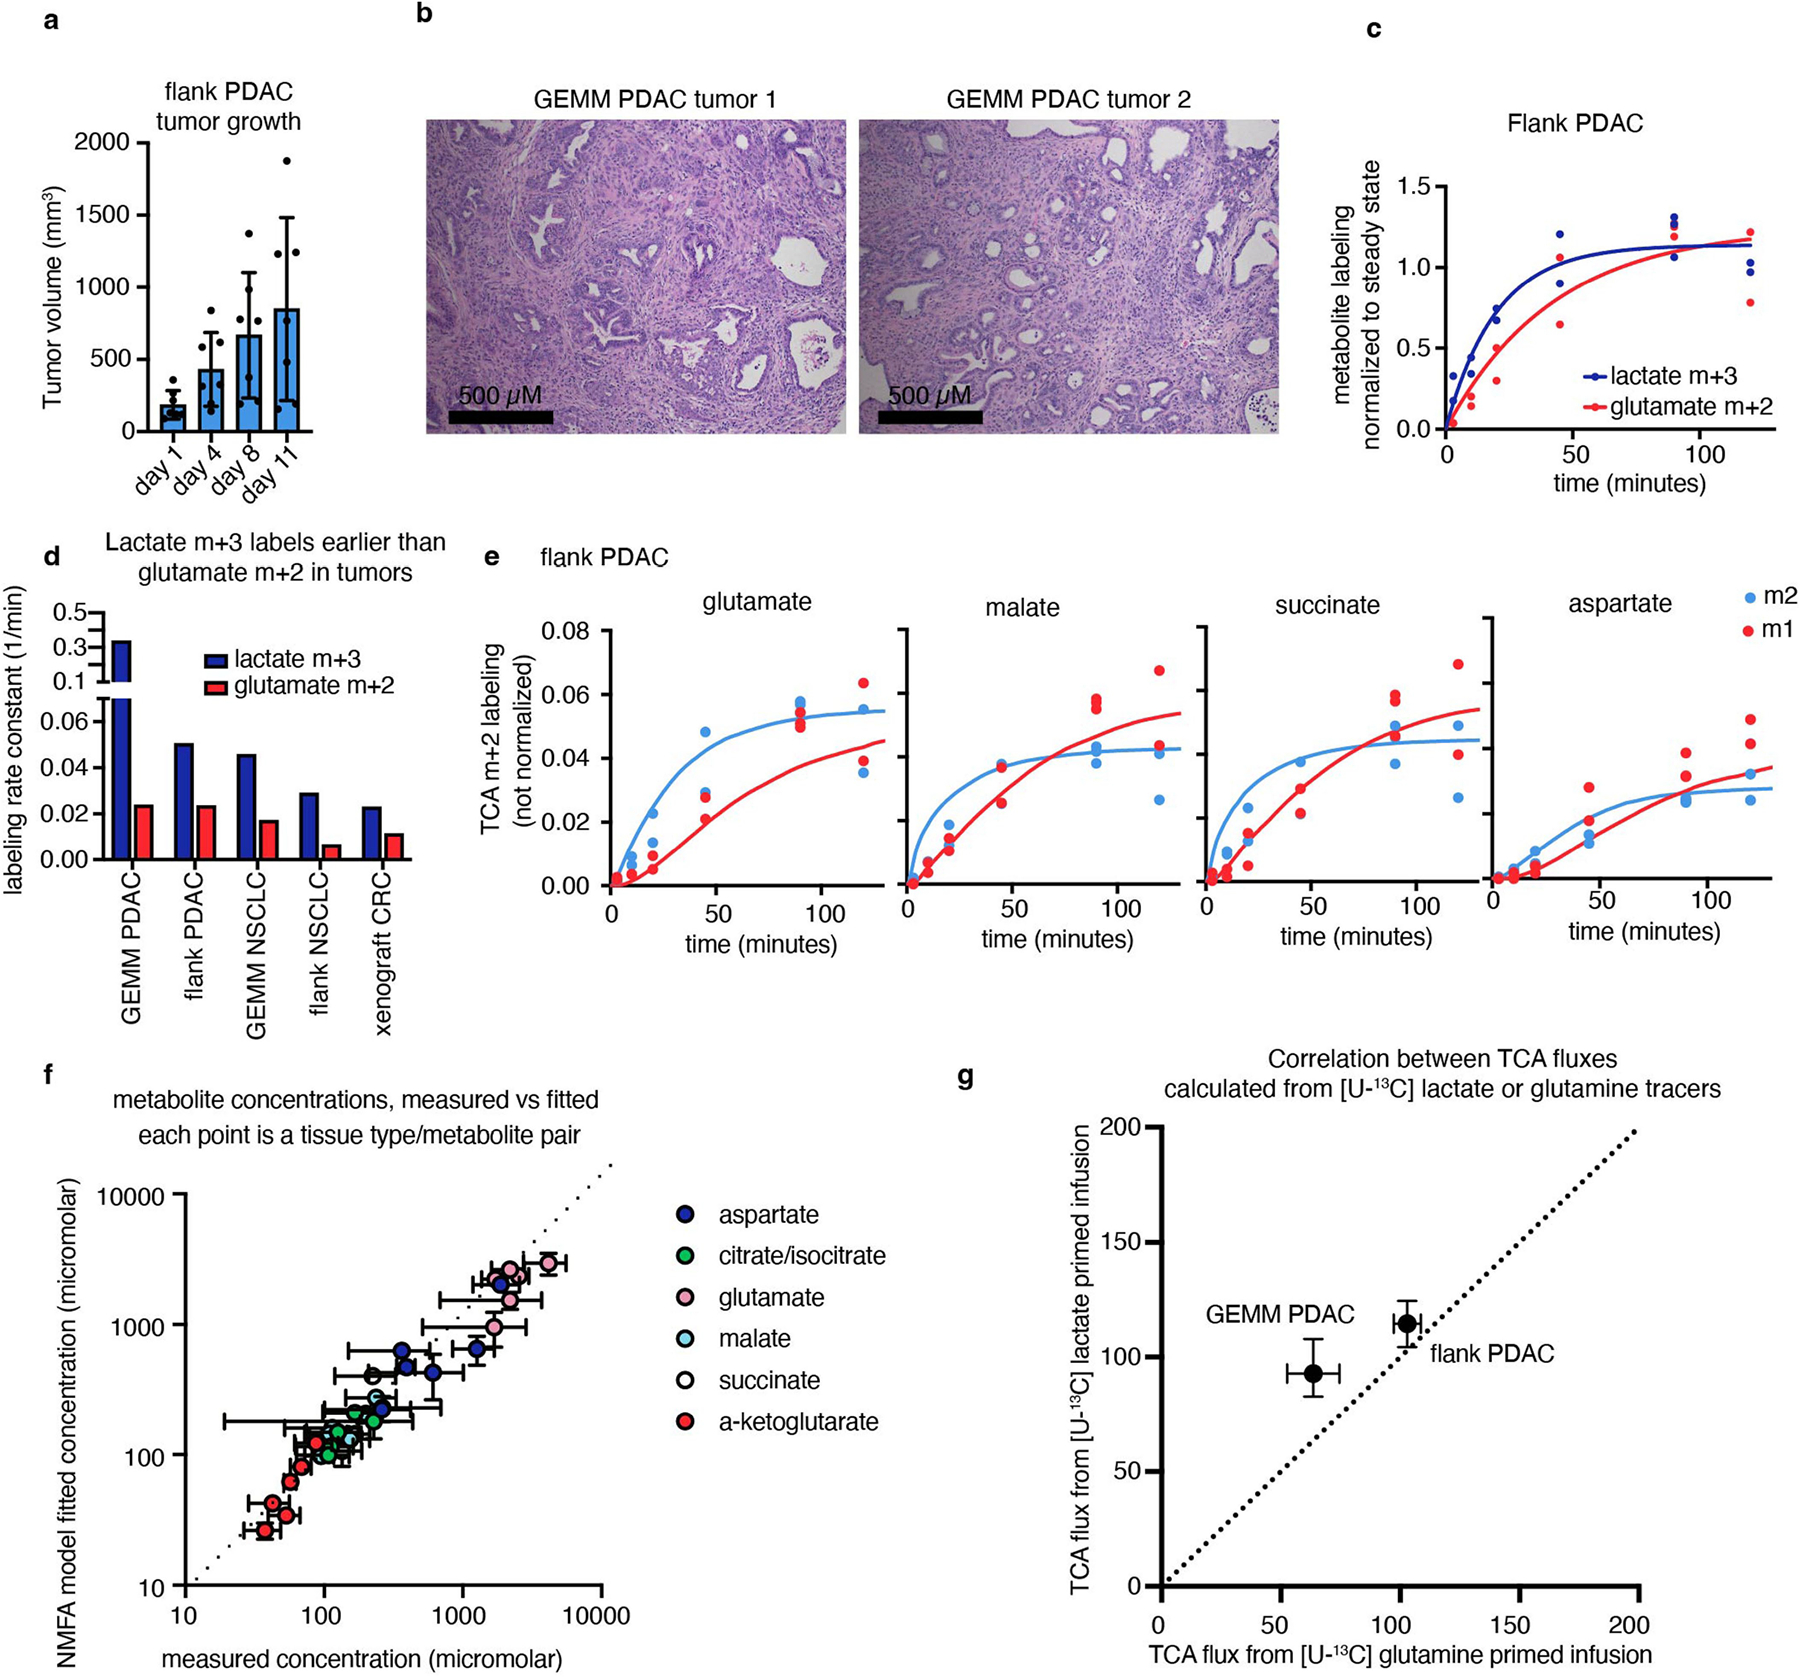
Extended Data Fig. 7 |. TCA flux measurement in tumours by kinetic [U-13C] lactate infusion.

(a) Growth of flank PDAC tumours, n = 7 mice per timepoint, error bars show mean +/− standard deviation. (b) Hematoxylin and eosin staining of GEMM PDAC tumours showing tumours are viable and not necrotic, showing n = 2 mice, representative of n = 5 mice. (c) Timepoints of m+3 lactate and m+2 glutamate labelling in flank PDAC from primed [U-13C] lactate infusion, n = 13 mice. (d) Rate constant of glutamate m+2 labelling compared to lactate m+3 labelling in tumours from [U-13C] lactate primed infusion suggests that lactate entry does not gate TCA turning (n = 6 mice for GEMM PDAC, 13 for flank PDAC, 9 for GEMM NSCLC, 10 for flank NSCLC, 7 for xenograft CRC). (e) M+2 and m+1 labelling of TCA metabolites from [U-13C] lactate primed infusion (points) and model fits (lines) in flank PDAC tumours, n = 13 mice. (f) Model fit versus measured metabolite concentrations in tumours, each point is a metabolite from one tumour type, measured in n = 4 mice. (g) TCA fluxes of pancreatic tumour models calculated from [U-13C] lactate or [U-13C] glutamine primed infusion are similar (for lactate primed infusion, n = 6 mice for GEMM PDAC, n = 13 mice for flank PDAC; for glutamine primed infusion, n = 7 mice for GEMM PDAC, n = 10 mice for flank PDAC, n = 4 mice per tumour type to measure tumour metabolite concentrations). Error bars show medians+/− standard deviation.
