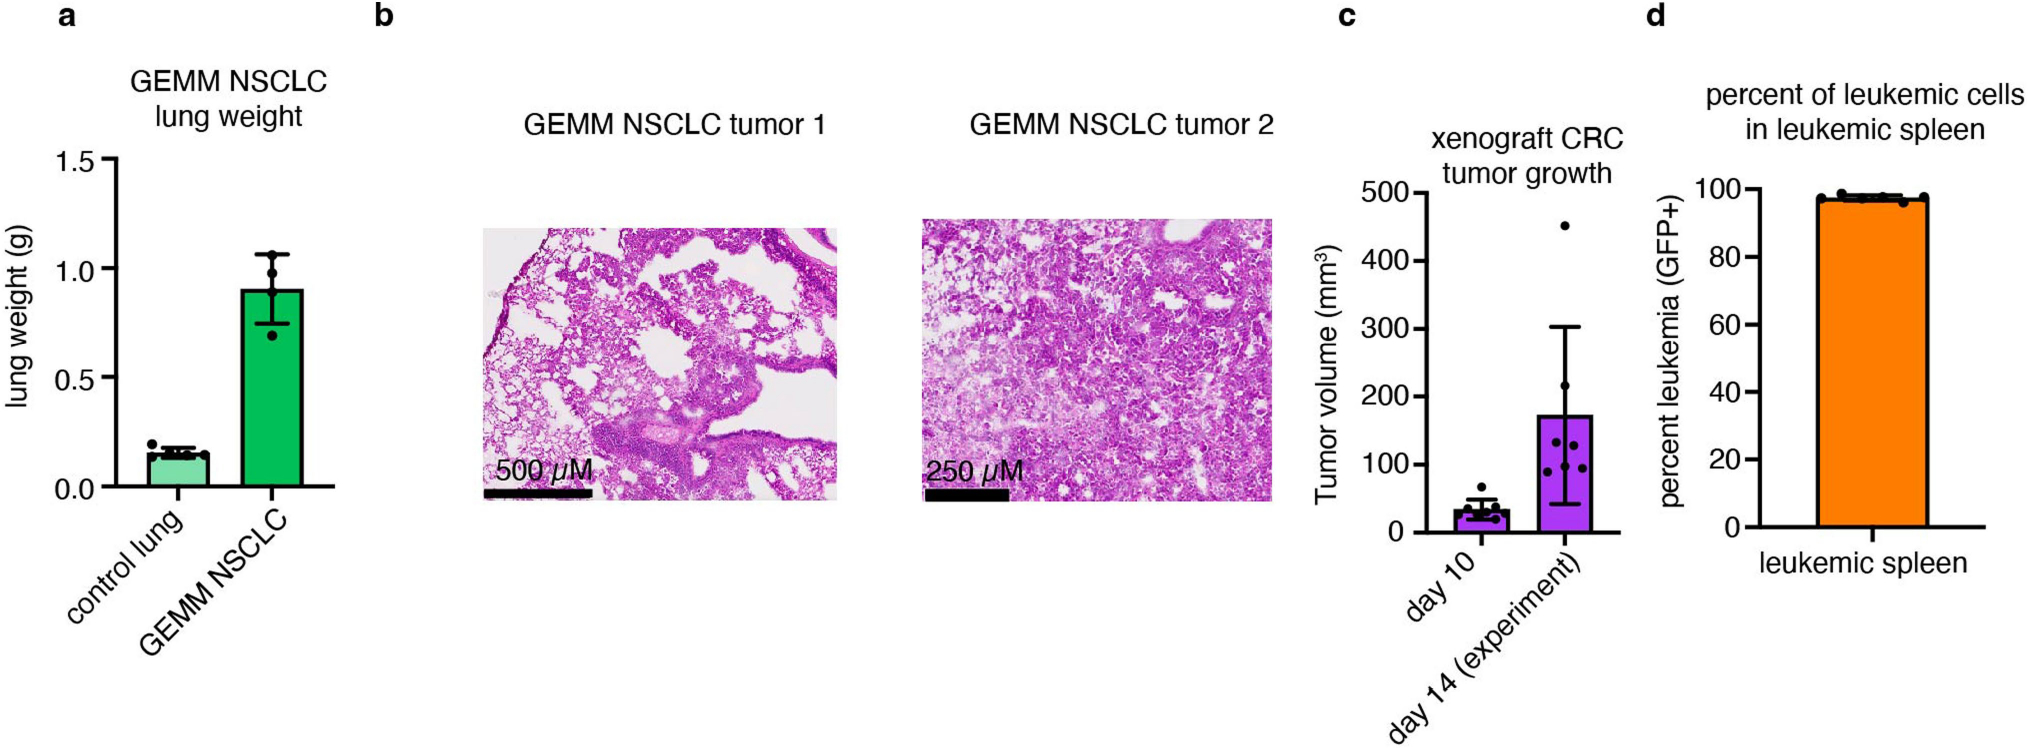
Extended Data Fig. 8 |. Tumour models used for TCA and glucose usage flux measurement.

(a) Weights of lungs from GEMM NSCLC mice compared to littermate controls, n = 5 mice for control lung and n = 4 mice for GEMM NSCLC. (b) Hematoxylin and eosin staining from GEMM NSCLC tumours showing tumours are viable and not necrotic, n = 2 mice. (c) Volume of xenograft CRC tumours, n = 8 mice at day 10 and n = 7 mice at day 14. (d) Percent of leukaemic cells in leukaemic spleens after red blood cell lysis, n = 6 mice. All error bars show mean +/− standard deviation.
