
Extended Data Fig. 10 |. ATP usage in tumours versus healthy tissues, and experimental sample sizes.
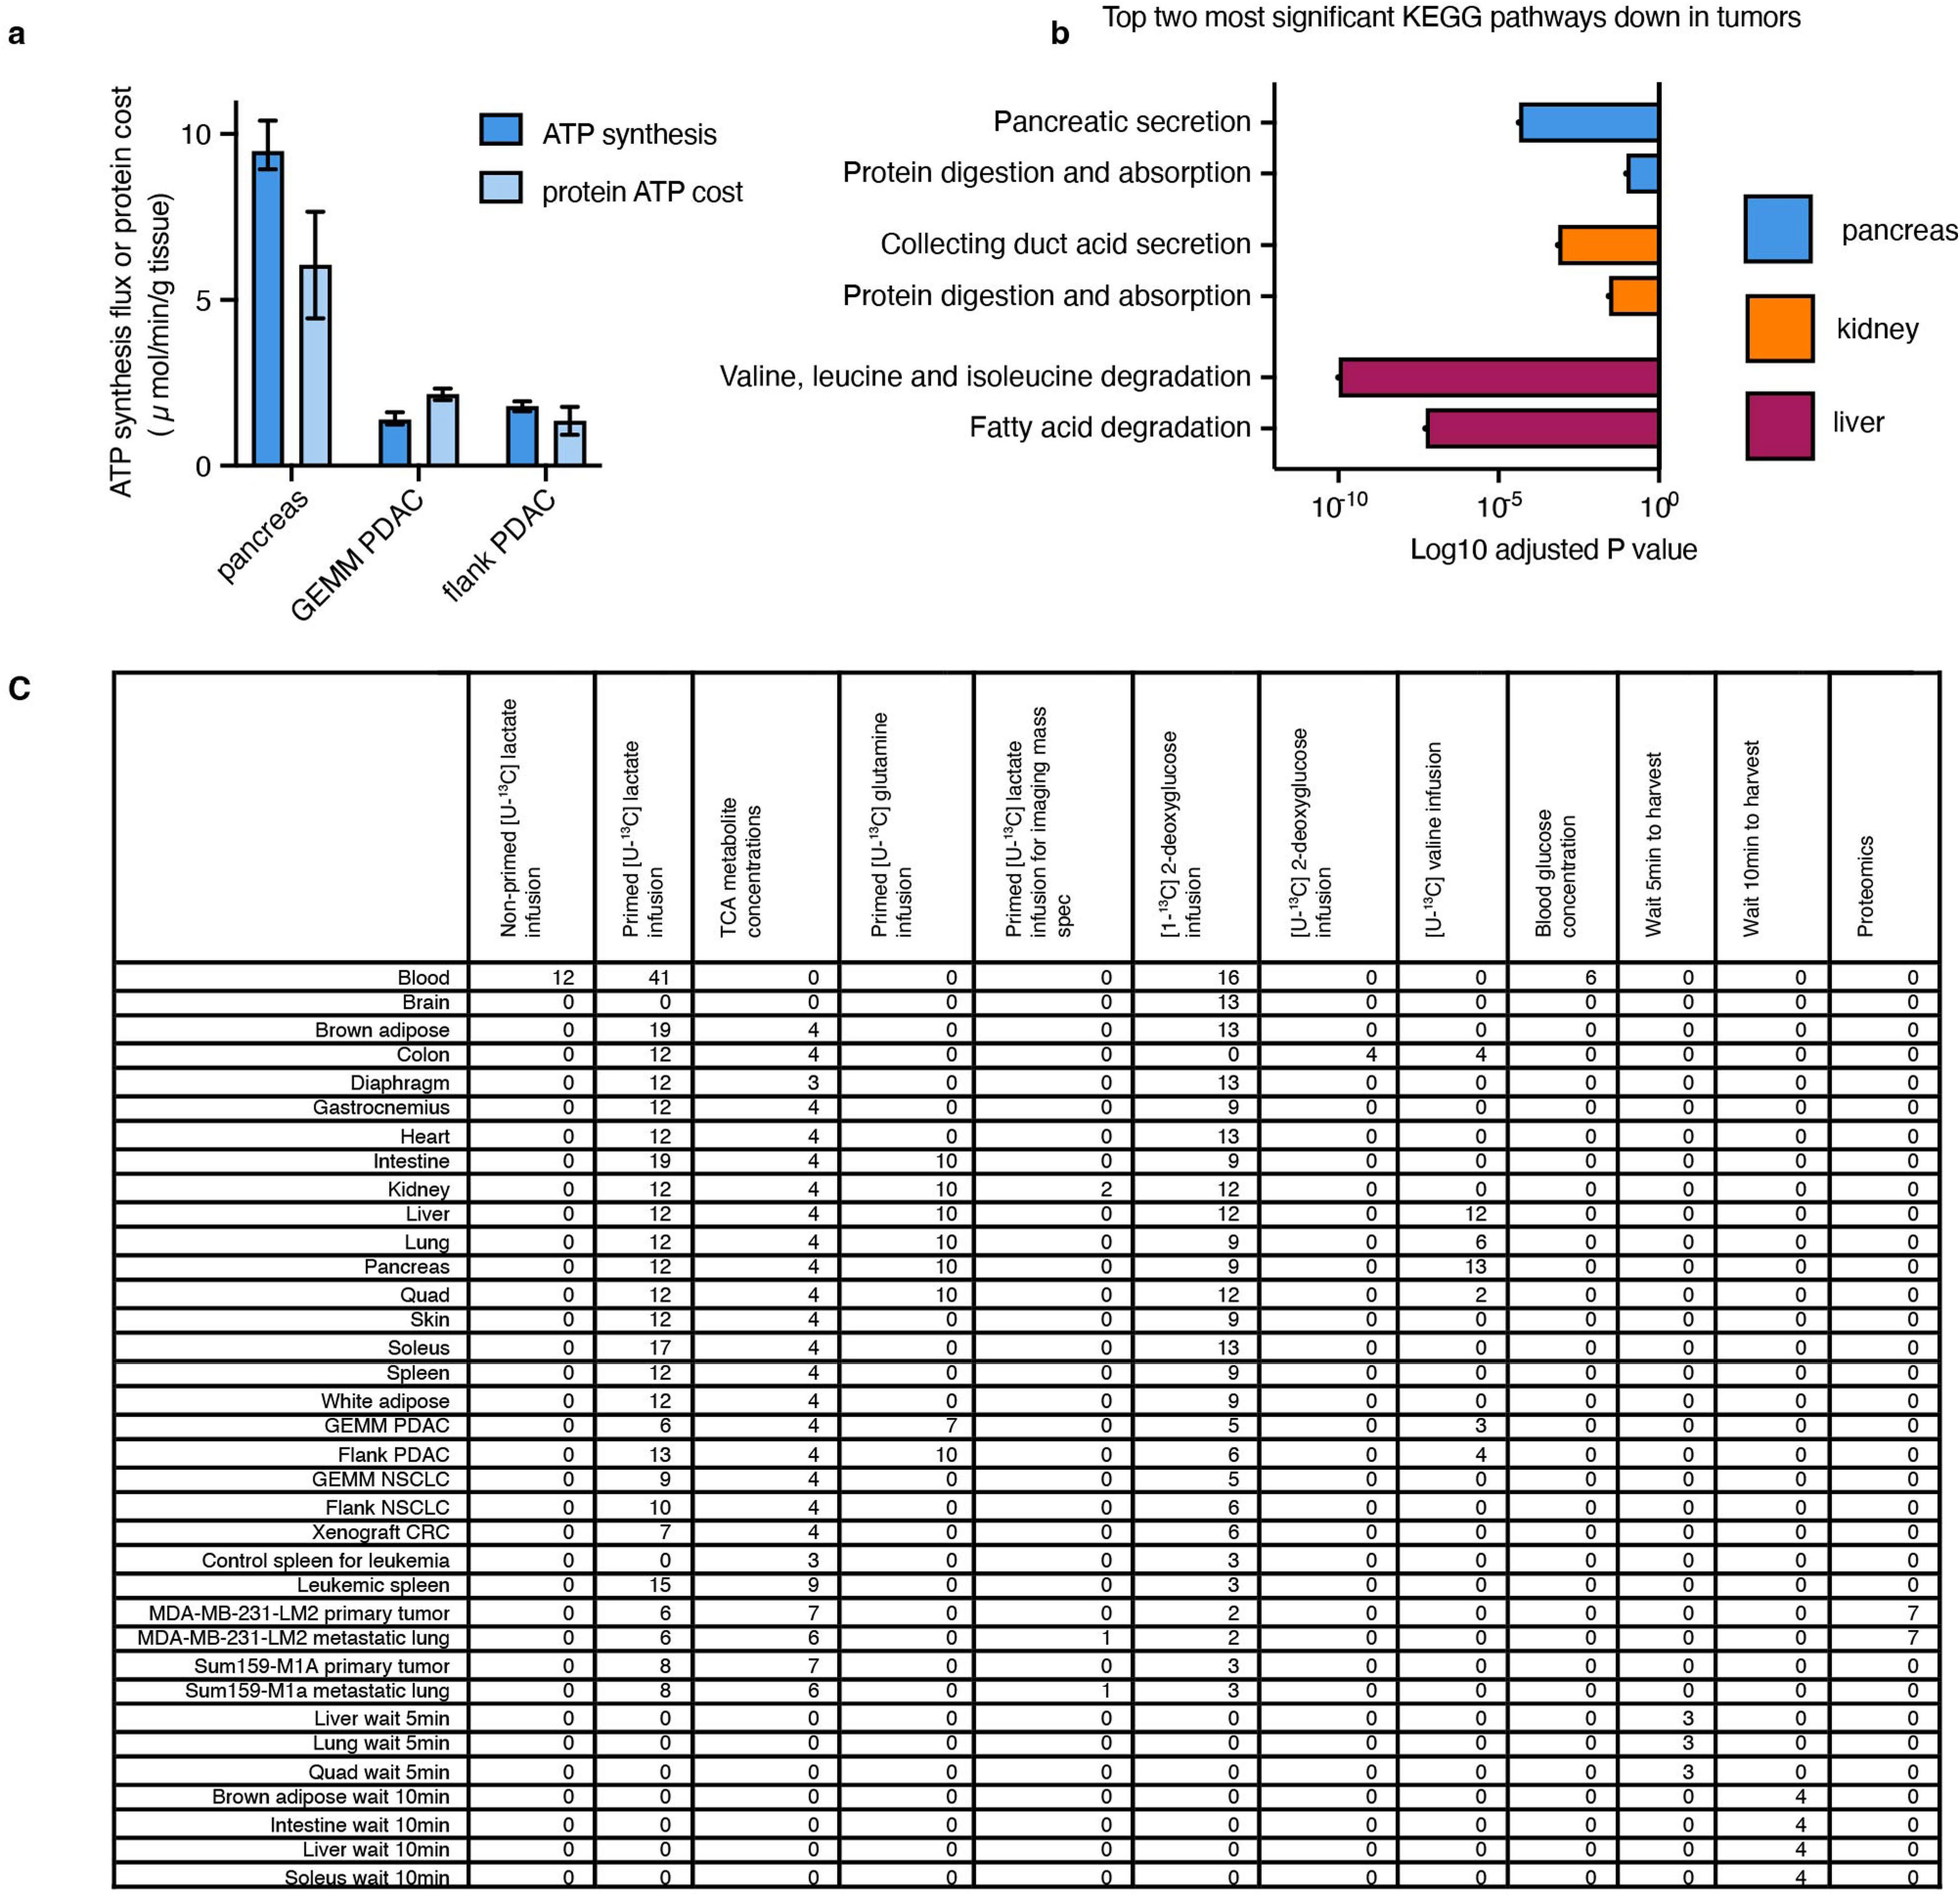
(a) Total ATP synthesis flux calculated from glucose use flux and TCA flux is similar to the predicted cost of protein ATP synthesis calculated from protein synthesis rates measured using [U-13C] valine infusion in pancreas and pancreatic tumours; n = 13 mice for pancreas, n = 3 for GEMM PDAC, n = 4 for flank PDAC; bars shown mean +/− standard deviation. (b) Adjusted p values of two most significantly enriched KEGG pathways for the genes downregulated in human tumours compared to the corresponding healthy tissue; n = 167 patients for healthy pancreas, n = 178 pancreatic tumour, n = 140 for healthy kidney, n = 884 for kidney tumour, n = 50 for healthy liver, n = 360 for liver tumour; data from UCSC Xena database. (c) Experimental replicates for all experiments shown in this study. Each replicate is a separate mouse tissue. All healthy tissues are from non-tumour bearing mice.