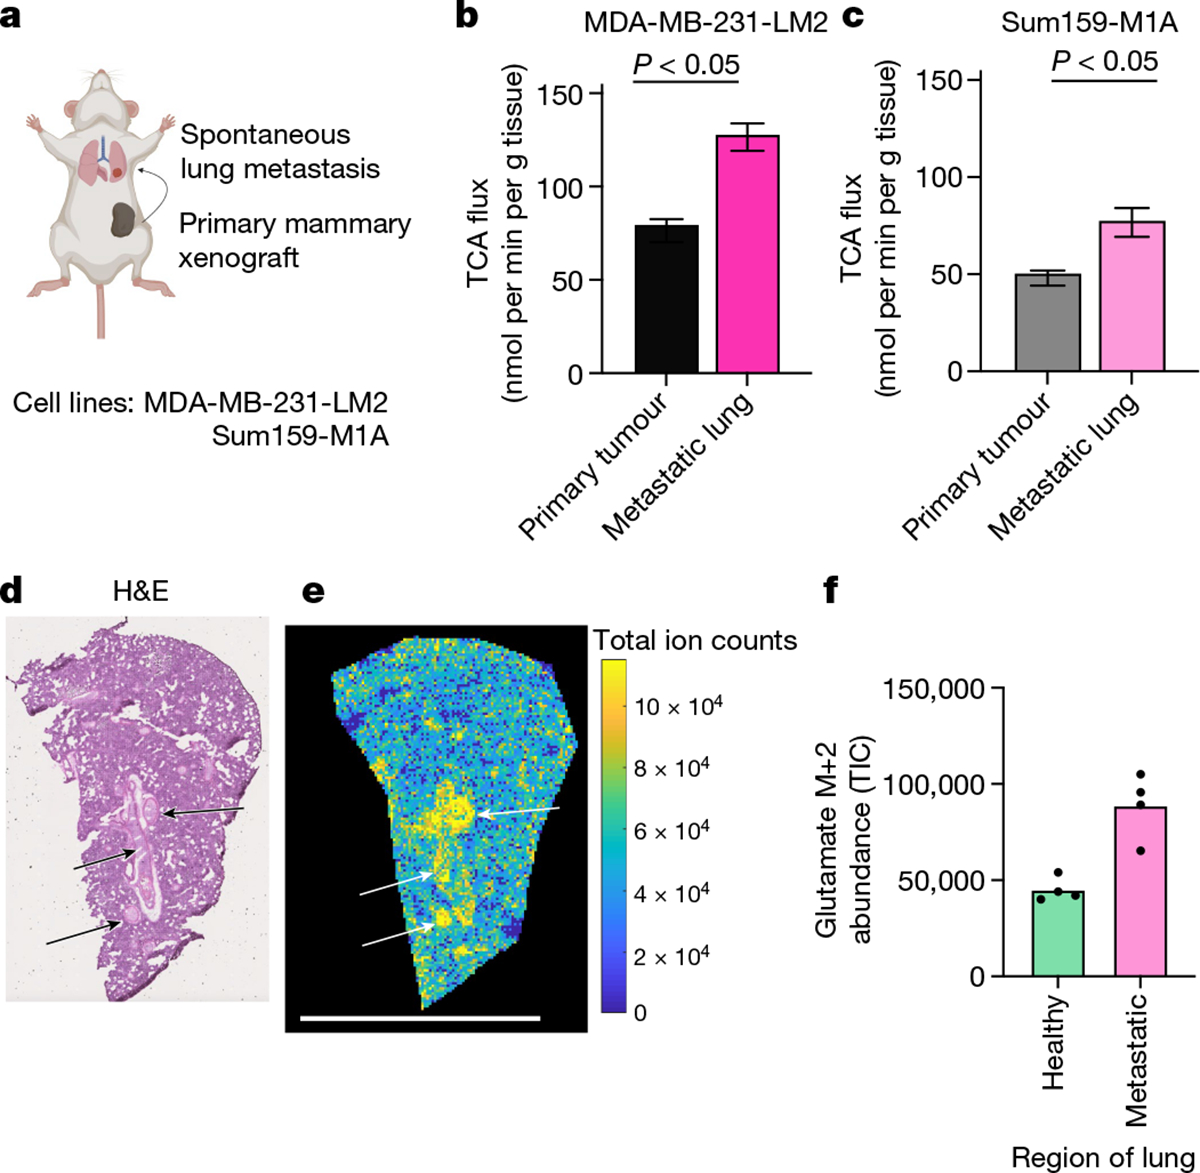
Fig. 4 |. Lung metastases have higher TCA flux than the primary tumours.

a, Schematic of mammary-fat-pad-implanted breast cancer xenograft tumours, which lead to spontaneous lung metastases. b, The TCA flux of primary mammary fat pad tumour and of whole lung containing metastases from mice bearing MDA-MB-231-LM2 xenograft tumours. n = 6 mice per tissue type for lactate infusion and n = 4 mice per tissue type for tissue metabolite concentrations. c, The TCA flux of primary mammary fat pad tumour and whole lung containing metastases from mice bearing Sum159-M1A xenograft tumours. n = 8 mice per tissue type for lactate infusion and n = 4 mice per tissue type for tissue metabolite concentrations. d, Haematoxylin and eosin (H&E) staining of the lungs of a mouse bearing a Sum159-M1A mammary fat pad tumour. The arrows indicate metastatic regions. e, IMS analysis of glutamate M+2 labelling intensity in the lung of a mouse bearing Sum159-M1A mammary fat pad tumour after 10 min [U-13C]lactate primed infusion. Scale bar, 5 mm. For d and e, experiments were performed on the same tissue slice; the arrows indicate metastatic regions identified from d. f, Quantification of glutamate M+2 intensity (in units of total ion counts, TIC) from metastatic and non-metastatic regions of the lungs from d and e. n = 1 mouse. Each point represents a different region of the image in e. For b and c, data are best estimates of flux from computational fitting of experimental data ± s.d. For b and c, P values were calculated using two-tailed t-tests. The schematic in a was created using BioRender.
