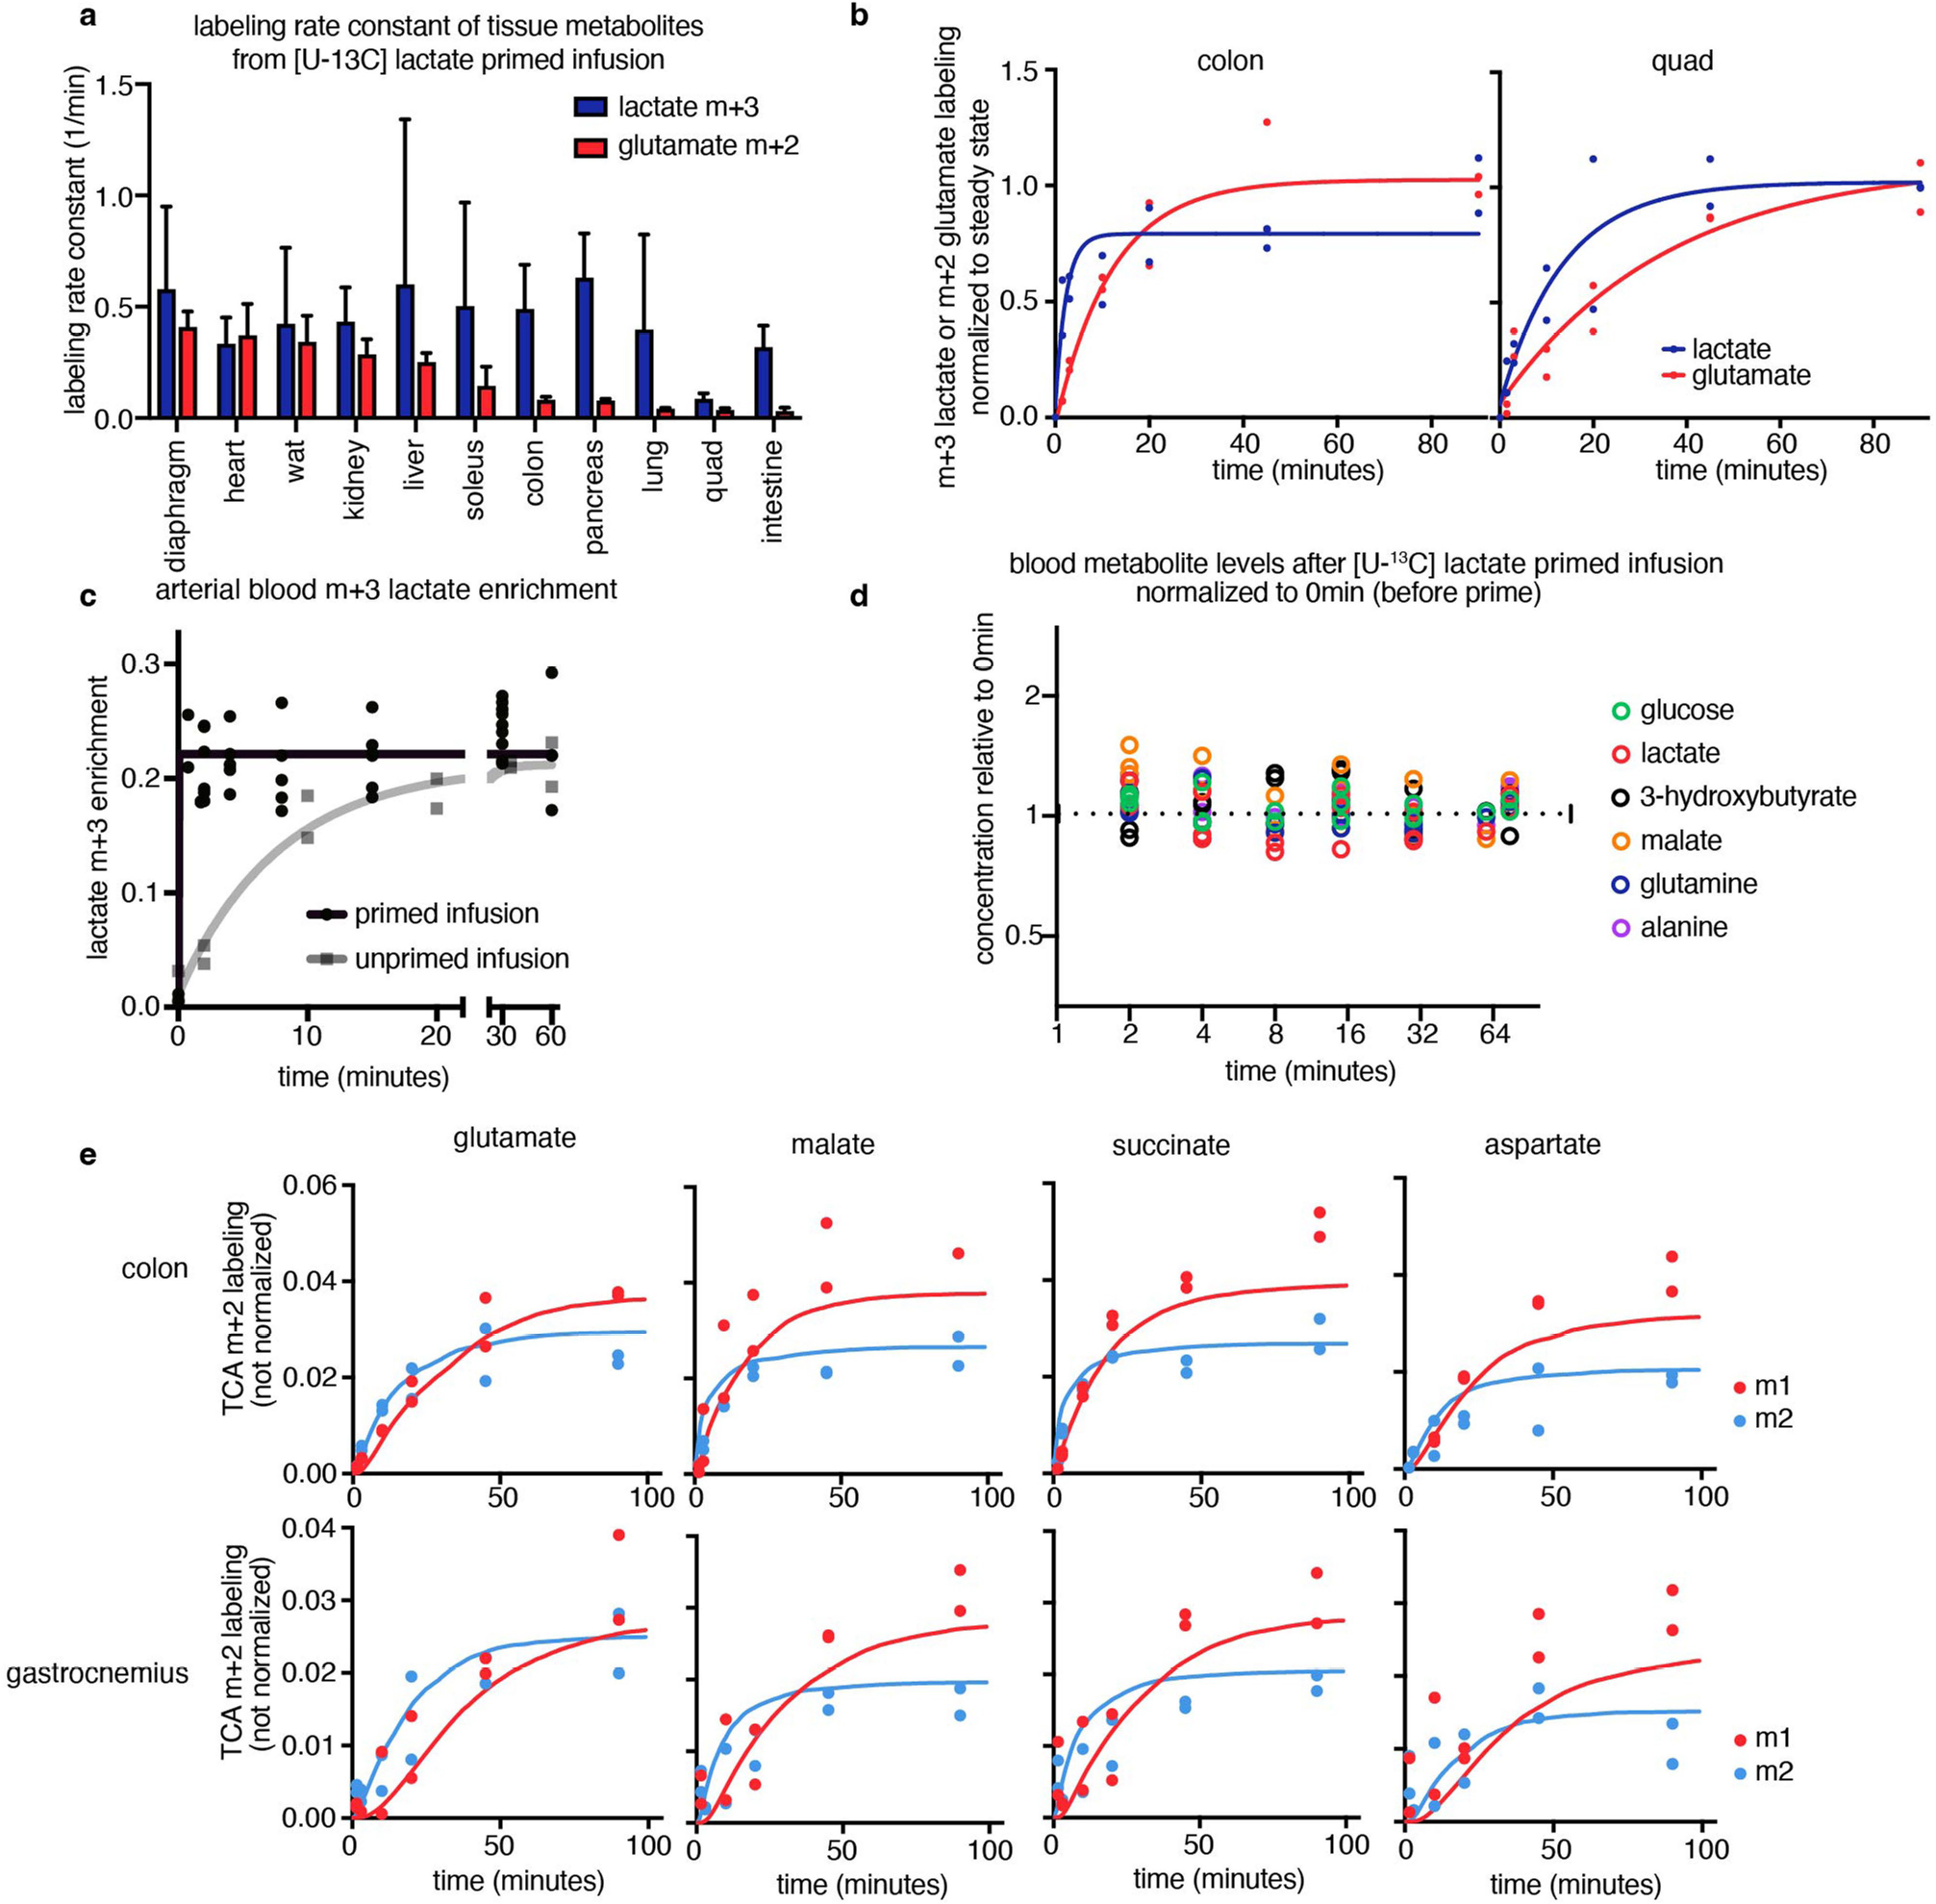
Extended Data Fig. 1 |. Kinetic primed [U-13C] lactate infusion.

(a) Rate constant of m+3 tissue lactate or m+2 tissue glutamate labelling from [U-13C] lactate primed infusion, calculated by fitting an exponential curve, bars show mean +/− standard deviation. For accurate TCA flux measurement, tissue lactate labelling (blue bars) must be faster than TCA labelling (red bars), lactate primed infusion timepoints in n = 12 mice per tissue (except n = 19 for intestine and n = 17 for soleus). (b) M+3 tissue lactate and m+2 tissue glutamate labelling in U-13C] lactate primed infusion, n = 12 mice each. (c) Arterial blood m+3 lactate enrichment in primed [U-13C] lactate infusion reaches steady state in around 90 s, while blood m+3 lactate enrichment in [U-13C] lactate infusion without a priming bolus takes around 20 min to reach steady state (primed: n = 8 mice, 4,4,5,5,6,6,6,and 6 blood timepoints each; unprimed: n = 2 mice, 6 blood timepoints each). (d) [U-13C] lactate primed infusion does not alter any arterial blood metabolite levels more than 1.5x, n = 3 mice (7,7, and 6 timepoints measured per mouse respectively). (e) M+2 and m+1 labelling of glutamate, malate, succinate, and aspartate from [U-13C] lactate primed infusion in colon and gastrocnemius muscle (not normalized). Curves are model fits, n = 12 timepoints for each tissue, each timepoint for one tissue type represents a tissue from a different mouse.
