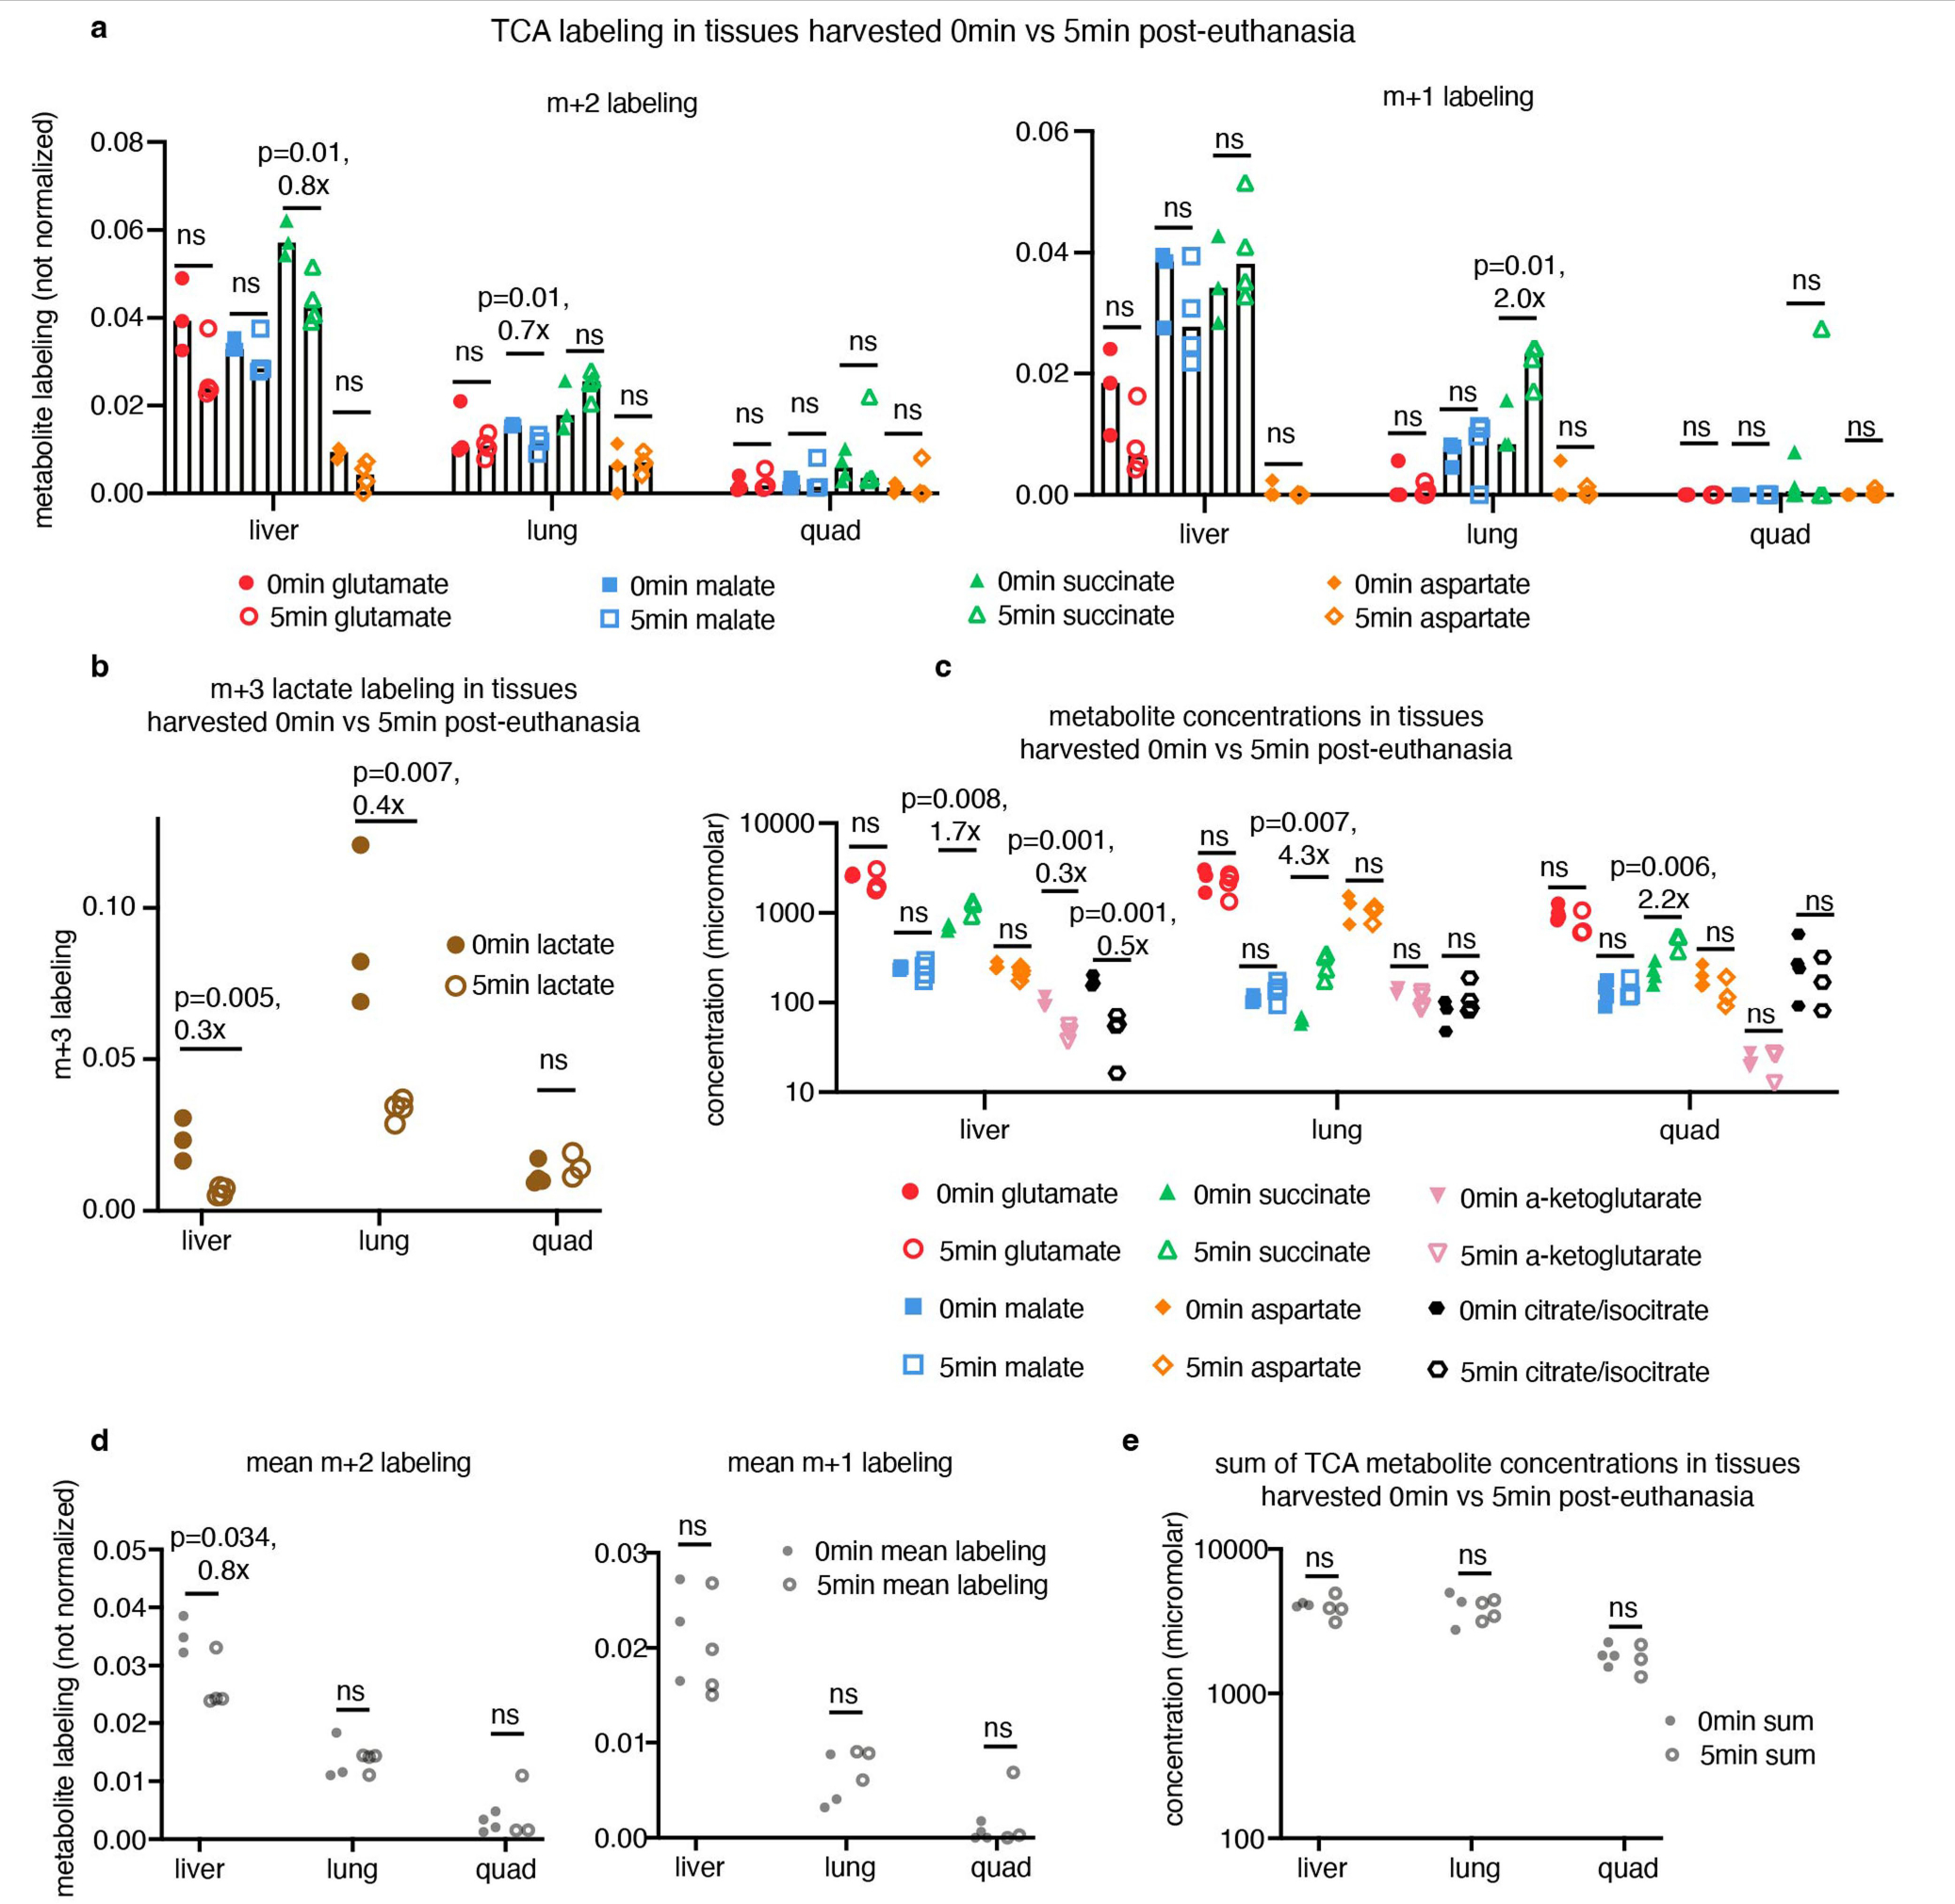
Extended Data Fig. 2 |. Five-minute tissue harvesting delay after primed [U-13C] lactate infusion does not greatly alter TCA metabolite labelling or concentration.

(a) TCA metabolite m+2 and m+1 labelling from primed [U-13C] lactate infusion in tissues harvested 0 or 5 min after euthanasia. (b) Tissue lactate m+3 labelling from same experiment as in (a). (c) Tissue TCA metabolite concentrations from the experiment in (a). (d) The mean m+2 and m+1 labelling of four TCA metabolites (glutamate, malate, succinate, aspartate) from the experiment in (a), each point represents the mean m+2 or m+1 labelling of four metabolites for one tissue from one mous e. (e) The sum of glutamate, malate, succinate, aspartate, citrate/isocitrate, and α-ketoglutarate concentrations from the experiment in (a), each point represents the sum of metabolite concentrations for one tissue from one mouse. All bar graphs show mean values, all t-tests are unpaired two-tailed t-tests; in all graphs, n = 3 mice for 0 min liver, 0 min lung, and 5 min quad; n = 4 for 0 min quad, 5 min liver, 5 min lung.
