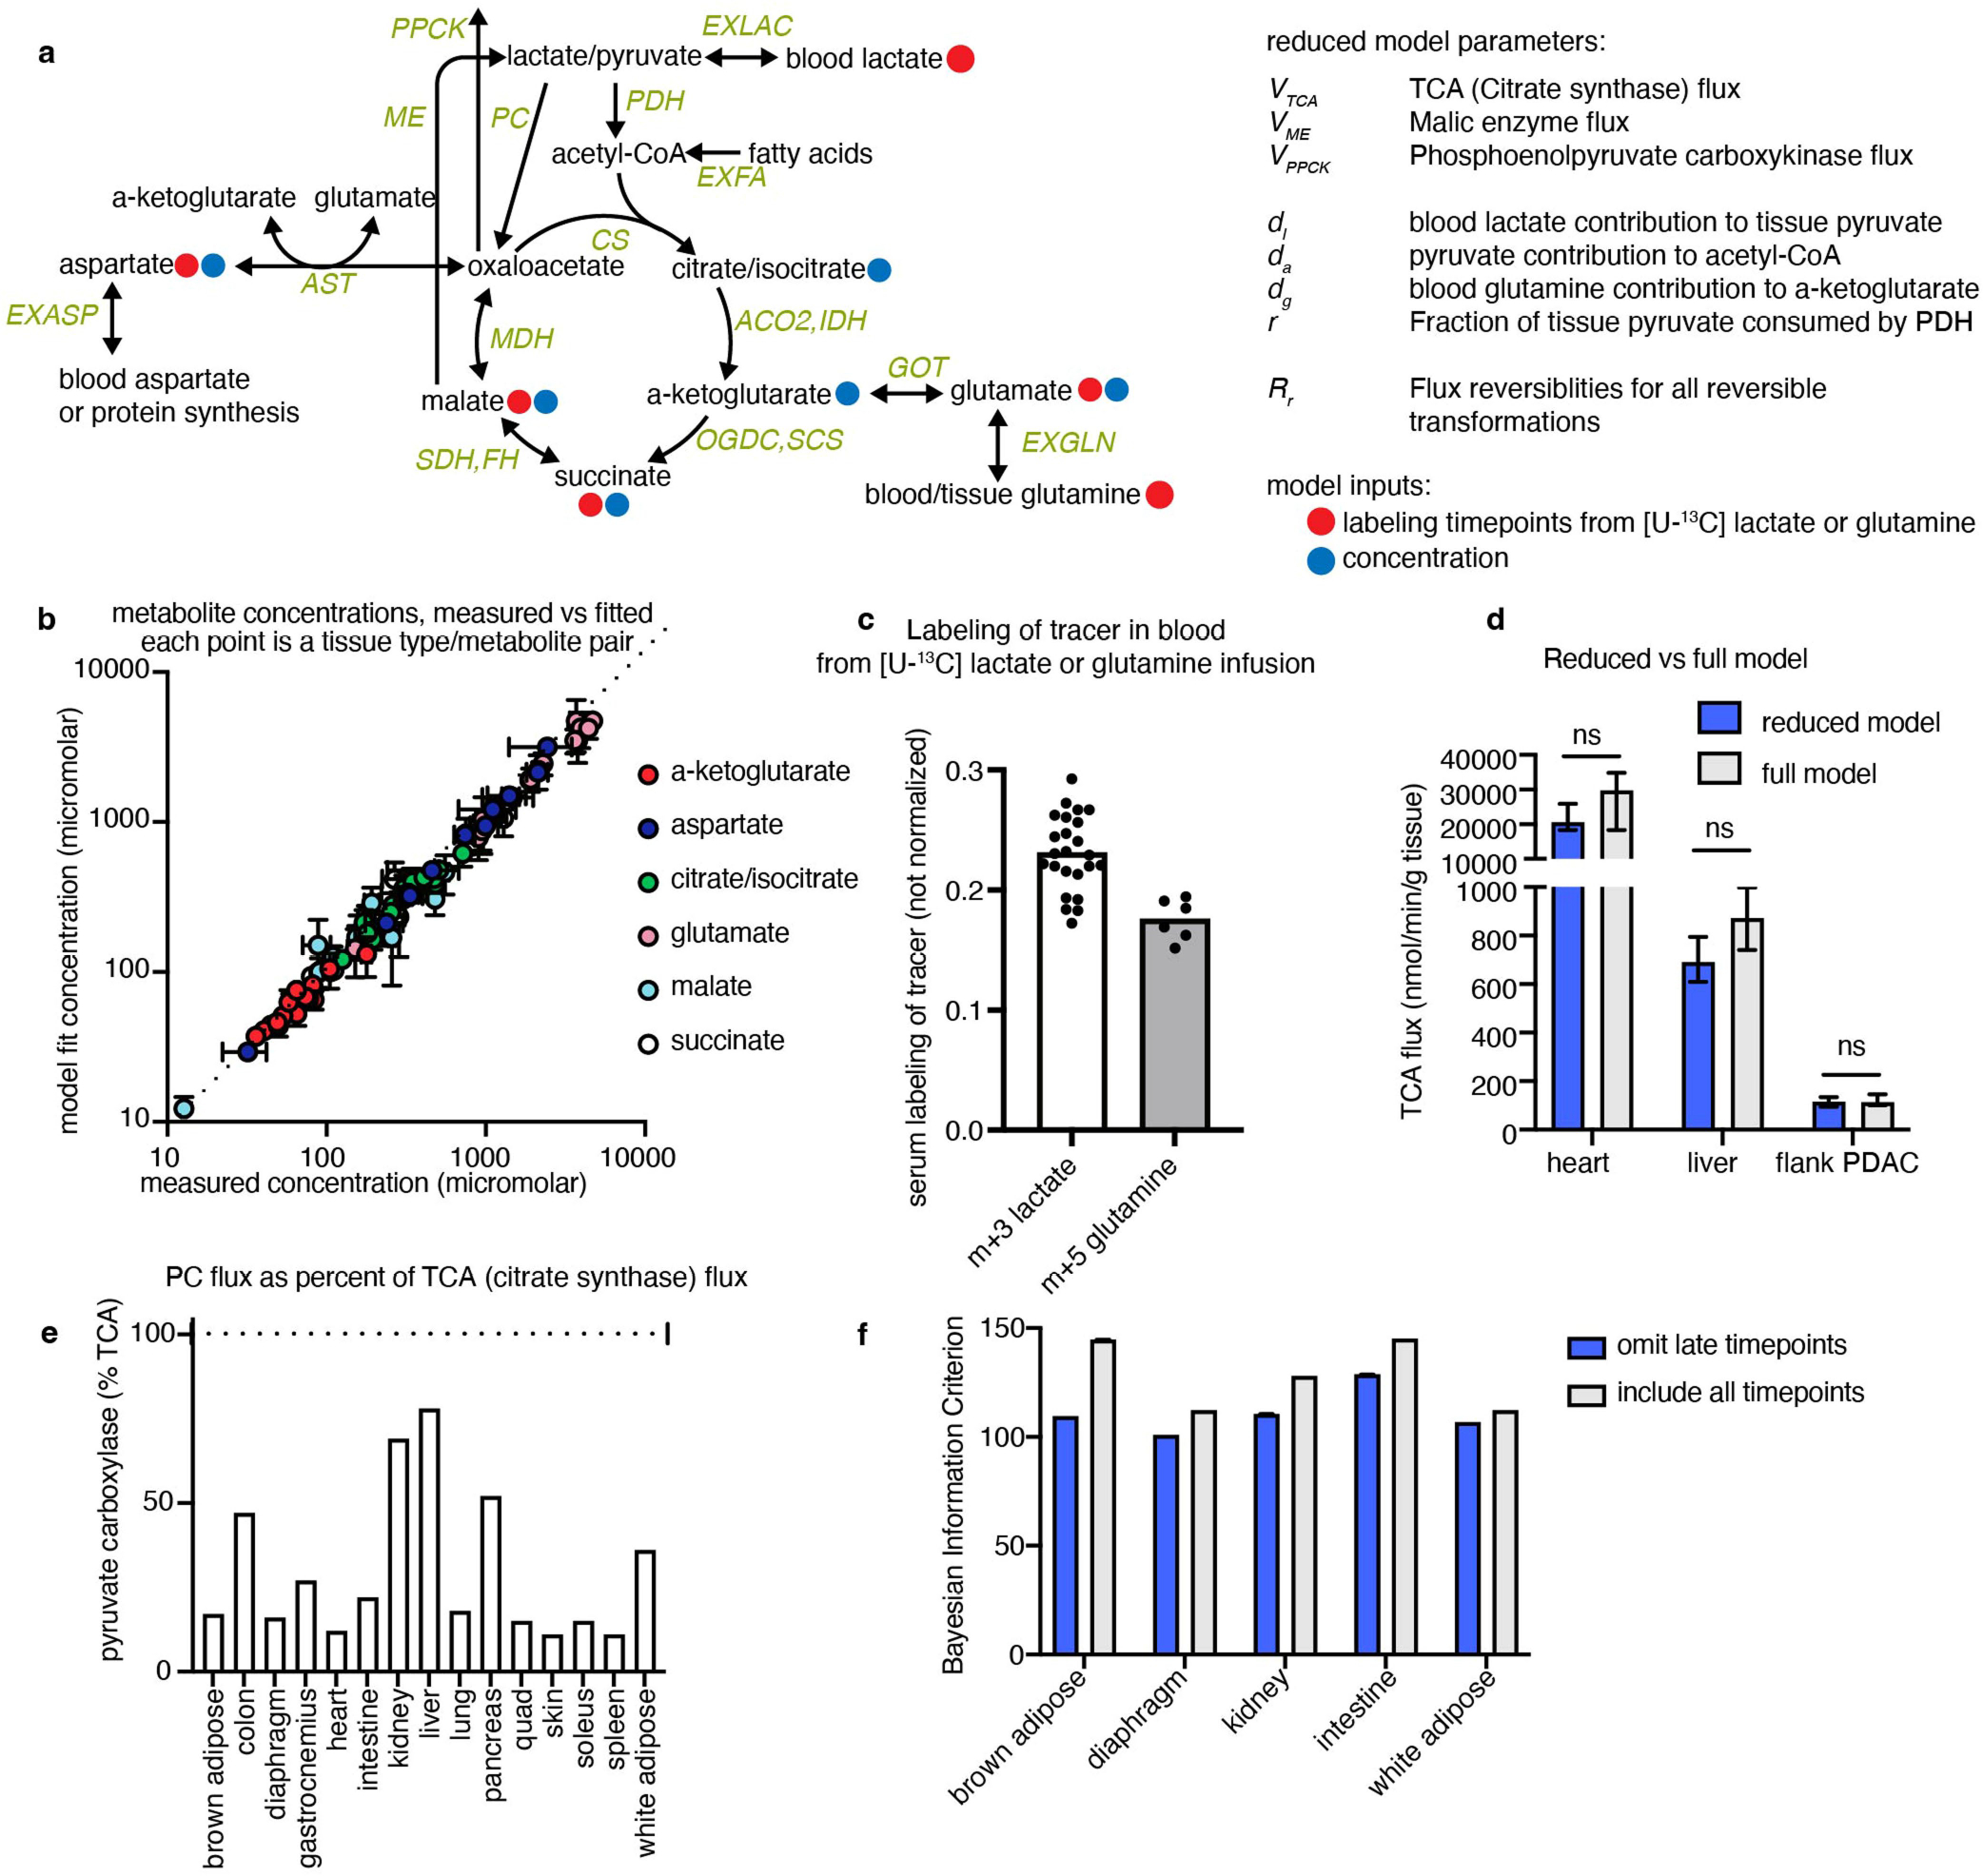
Extended Data Fig. 3 |. Non-stationary metabolic flux analysis (NMFA) model calculates in vivo tissue TCA fluxes.

(a) Schematic of model structure for calculating TCA flux, indicating the concentrations and labelling timepoints used as input data. (b) Tissue TCA metabolite concentrations fitted by NMFA model vs. measured experimentally, n = 4 mice per measurement except n = 3 for diaphragm, each point is one metabolite from one healthy tissue. (c) Labelling of m+3 lactate or m+5 glutamine in arterial blood during [U-13C] lactate or glutamine primed infusions respectively, used as input data for TCA flux model, n = 3 mice with 8 blood timepoints each for lactate, n = 2 mice with 6 timepoints each for glutamine. (d) Including collisions of multiple labelled metabolites in the model (‘full model’) does not alter calculated TCA fluxes compared to model without including such collisions (‘reduced model’) (see Methods and Supplementary Note for description of models). (e) Calculated pyruvate carboxylase flux as a fraction of total TCA flux (citrate synthase flux). (f) Omitting some late [U-13C] lactate timepoints lowers (i.e. improves) Bayesian information criterion for certain tissues. Error bars show mean +/− standard deviation, p-values from two-tailed t tests.
