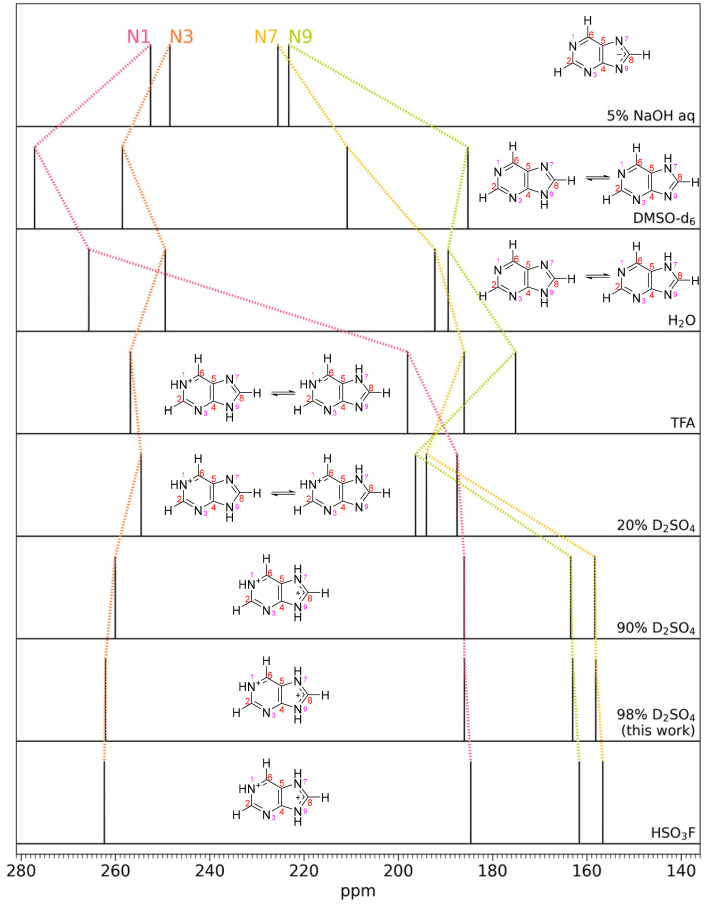
Fig. 7.
Purine 15N NMR spectral peaks for different solvent acidities. The ordering from top to bottom is in increasing acidity of the solvent. The change in chemical shifts of different N atoms indicate different protonation states of the N atoms; each of the four peaks correspond to a different N atom as indicated. The second and third row shows purine in DMSO-d6 and H2O, which can be considered well-known standards. Top: in the basic aqueous solution of 5% NaOH, all of the N atoms are deprotonated (i.e., magnetically deshielded) and the N atom spectral peaks are shifted downfield as compared to the H2O and DMSO solutions. With increasing solvent acidity, N atoms sequentially get protonated, causing dramatic upfield spectral peak migration as added protons provide more magnetic shielding. In some cases (e.g., DMSO-d6 and H2O) two tautomeric structures exist in equilibrium due to fast proton exchange; the relative abundance controls the spectral peak positions. See text for more details. Data and figure adapted from ref. 40. Our data at 98% D2SO4 match the high-acidity solvents 90% H2SO4 and FSO3H from ref. 40, demonstrating protonation of the N1, N7, and N9 nitrogen atoms in the purine molecule. TFA is trifluoroacetic acid.

