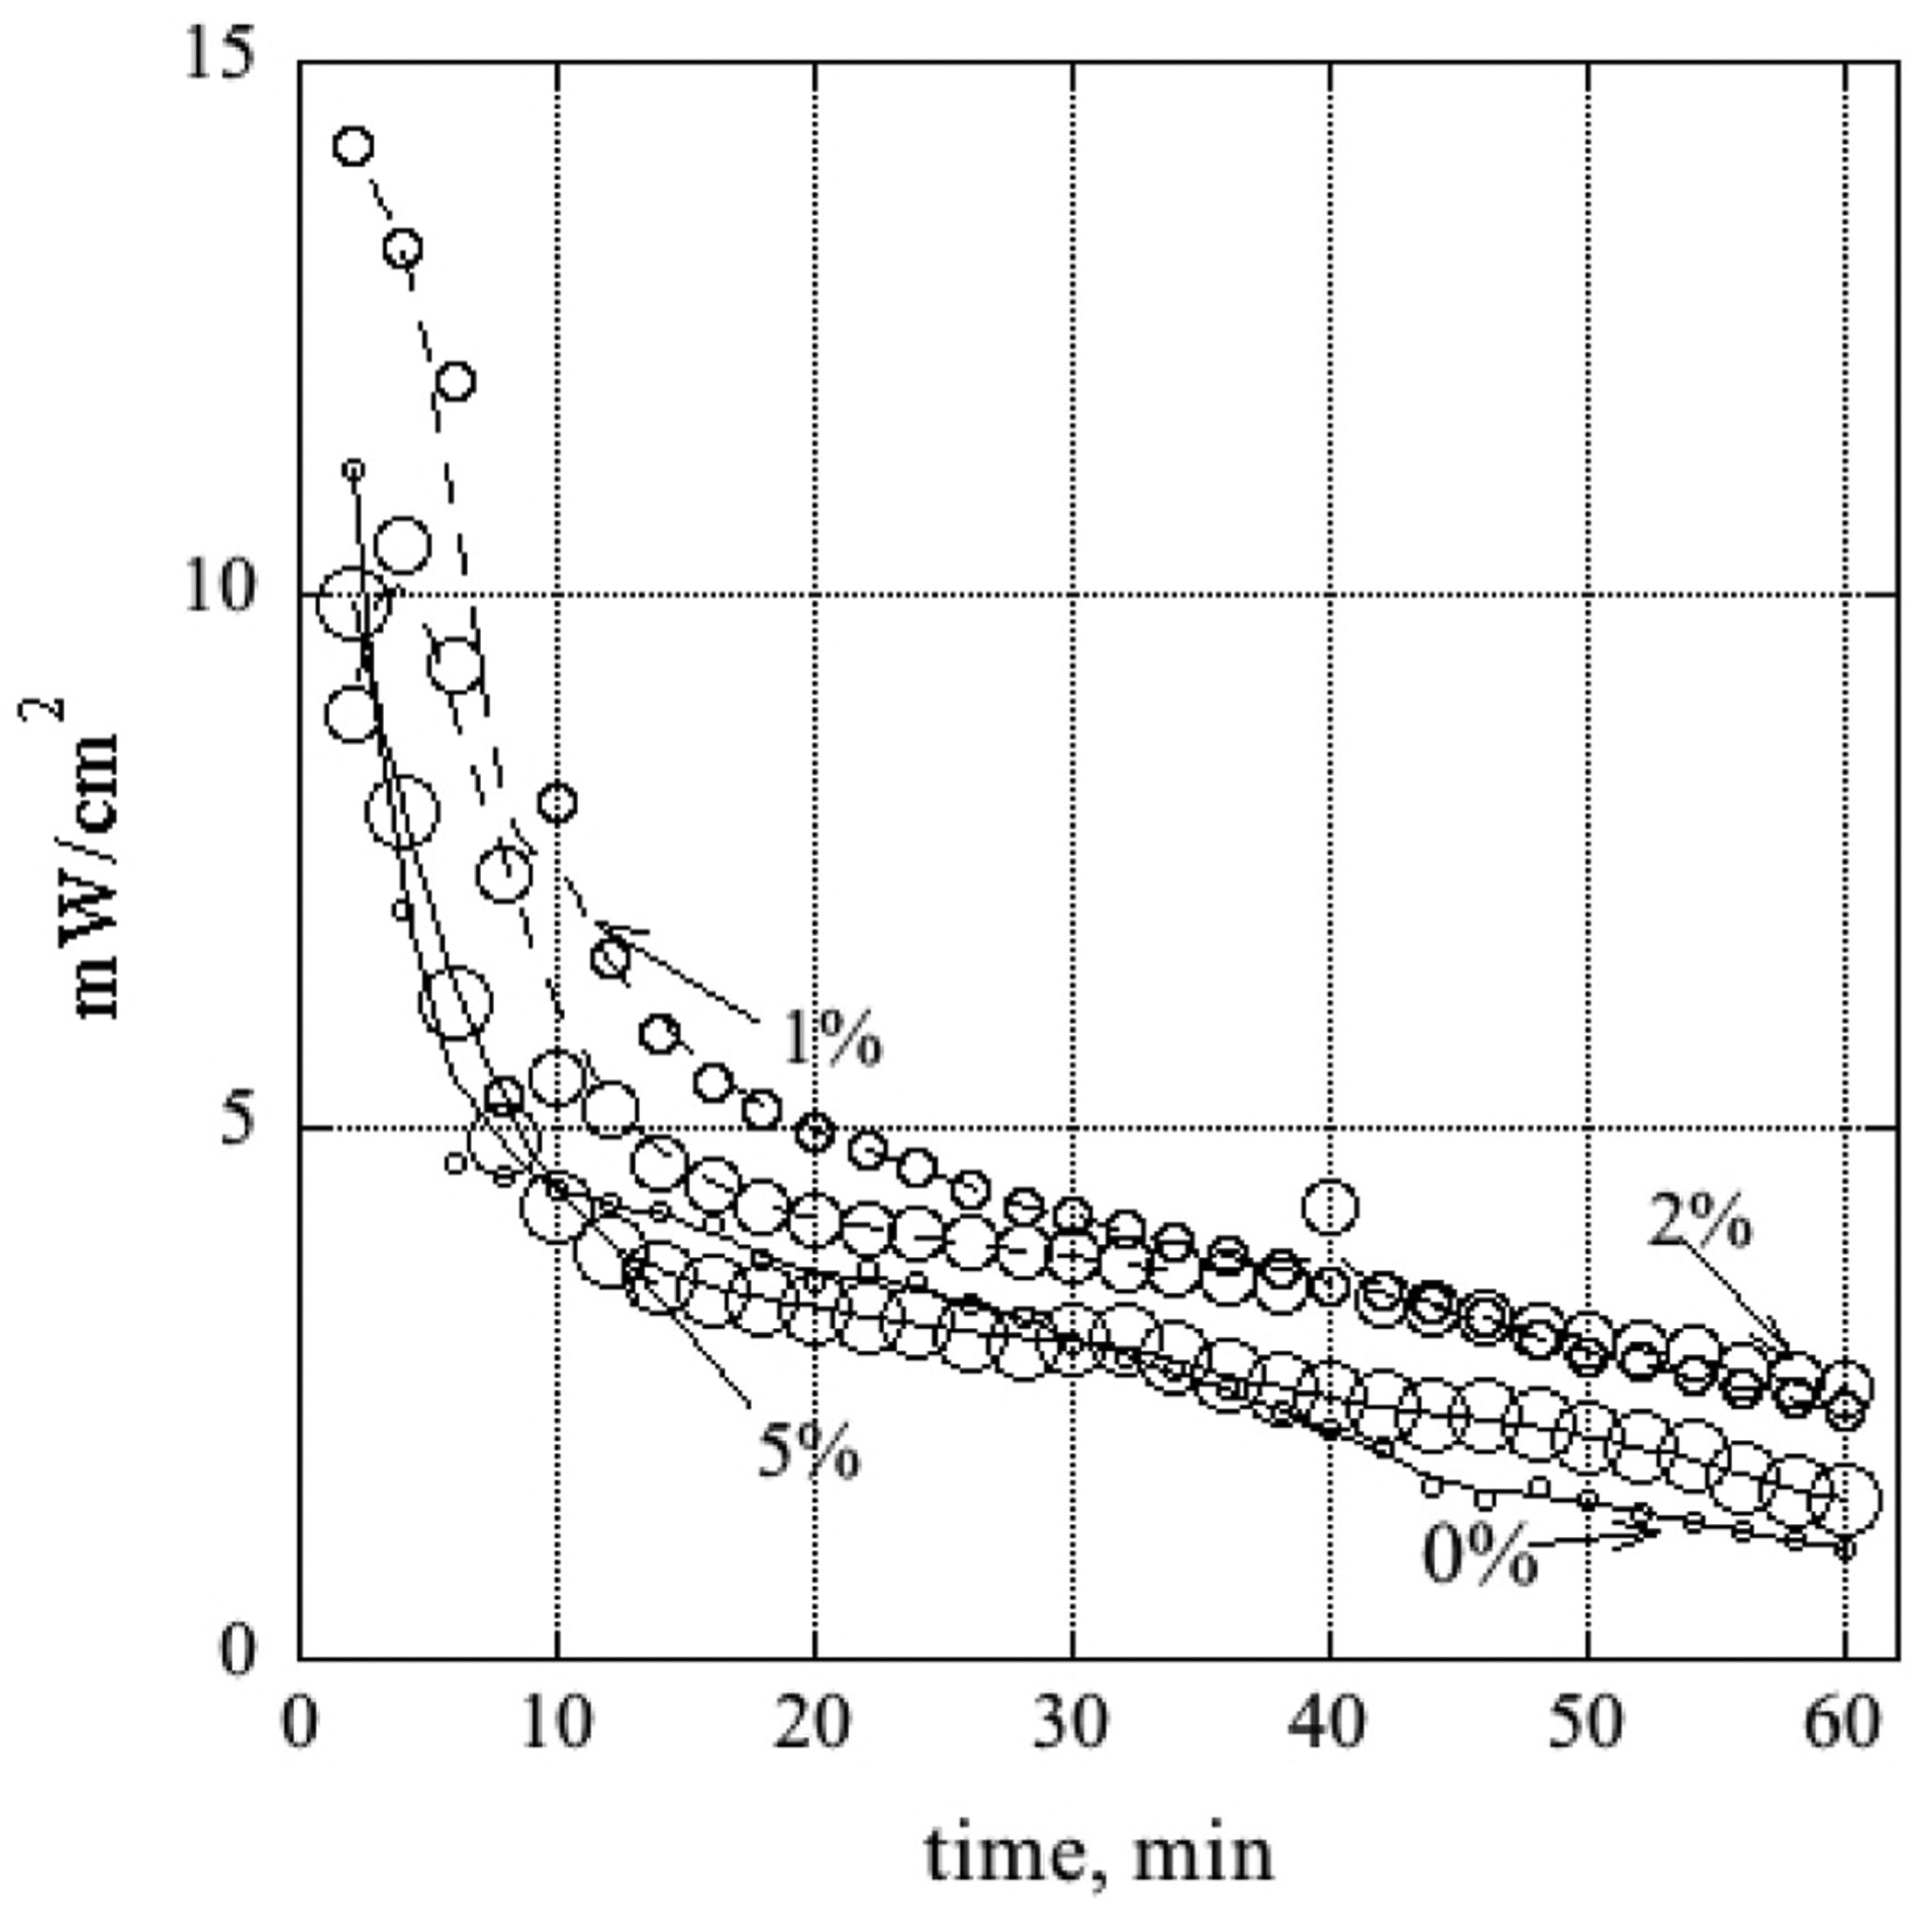
Fig. 10.

Power density versus time when load held constant for fuel feed composition 0.5 M glucose and 0.5 M KOH. The labels are the CA concentration in the DL coating solution. Symbol size increases as the % increases. The smoothing lines have been drawn to guide the eye.
