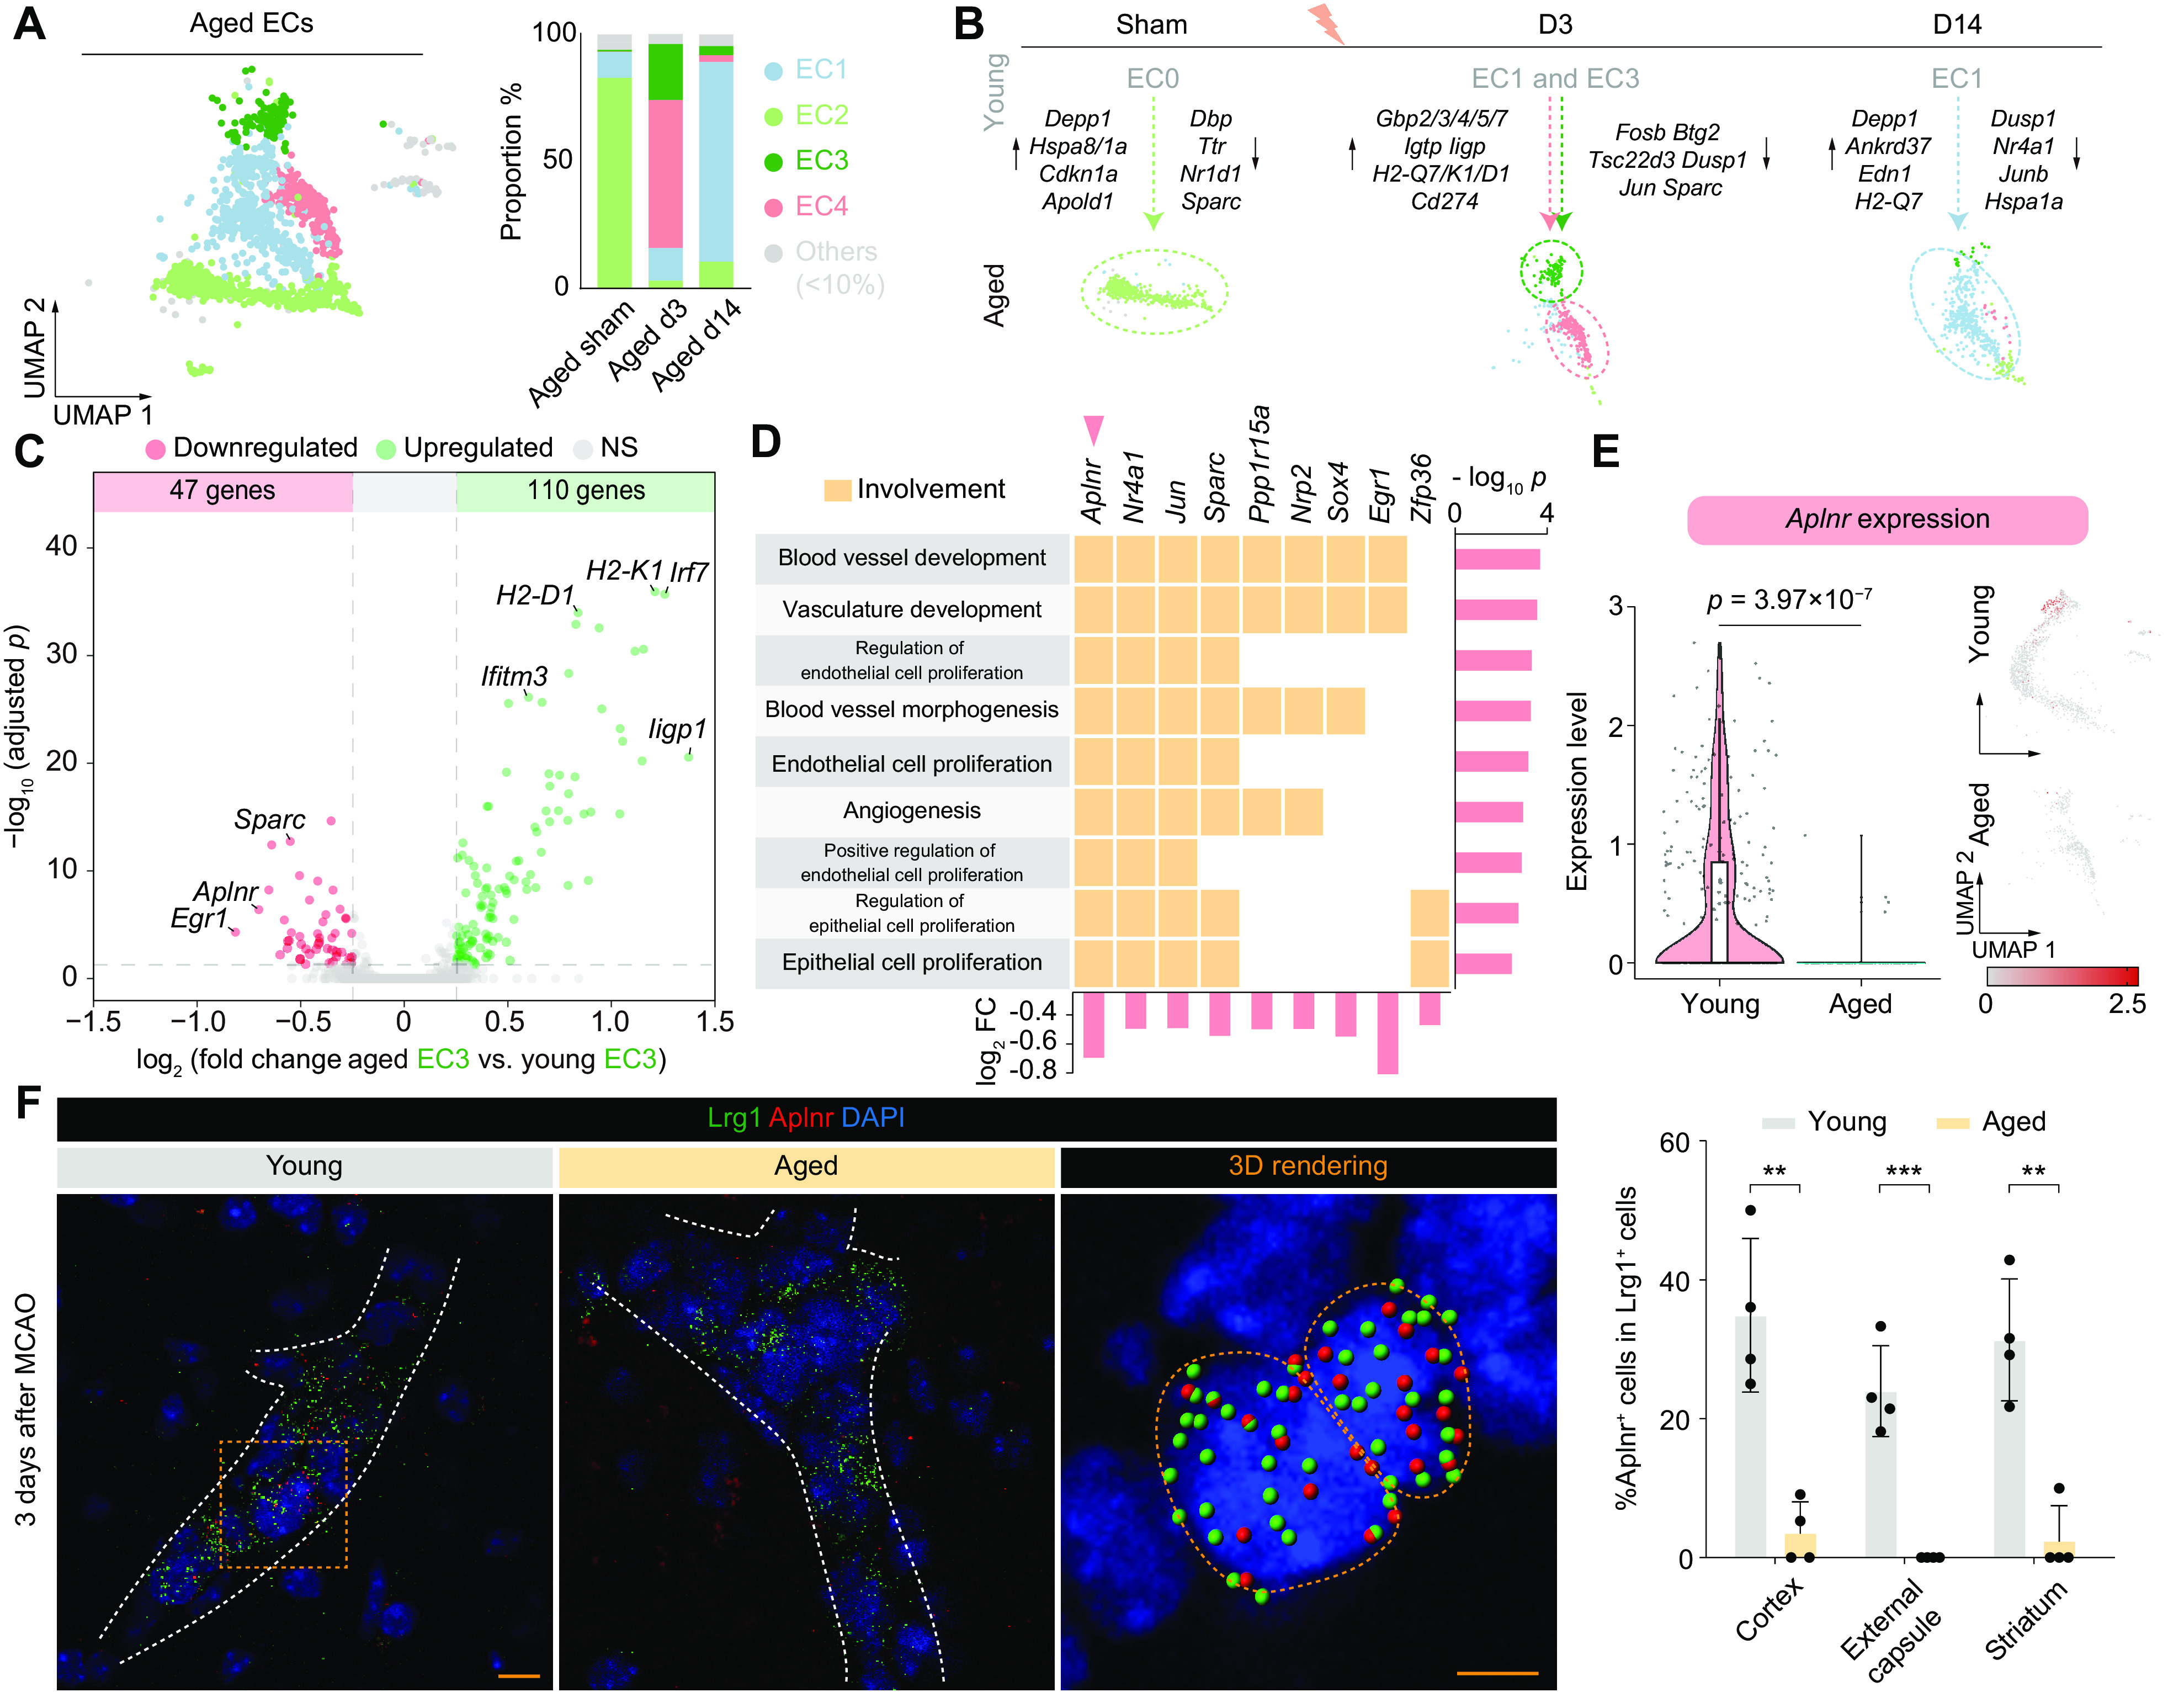
Fig. 3.

Proangiogenic features found in endothelial cells after stroke are lost in the aged brain. (A) UMAP visualization (Left) of 1,914 ECs from all aged groups. Stacked bar plots (Right) showing the proportions of the major subsets (accounting for >10% in all groups) in each group. (B) An overview of the aging-induced compositional and transcriptome transitions (colored arrows) in all groups. Representative DEGs between two groups are listed (black arrows). (C) Volcano plot showing 47 down-regulated (red) and 110 up-regulated (green) DEGs (|log2 FC| > 0.25 and Bonferroni-adjusted P < 0.05) of aged EC3 compared to young EC3. (D) Tile plot showing the relationship between all nine inhibited angiogenesis-associated biological processes and nine contributing genes. Bar plots show-log10 P of all terms (Right) and log2 fold change of all involved genes (below). (E) Violin plot (Left) and UMAP visualization (Right) showing the expression level of Aplnr in EC3 of young and aged groups as a natural log transformation of the raw count data. (F) Representative images of Aplnr and Lrg1 fluorescence in situ hybridization (FISH) in peri-infarct areas of young and aged mice at 3 d after MCAO. White dashed lines show the outlines of blood vessels based on the distribution of nuclei. Yellow lines in 3D rendering indicate boundaries of individual DAPI+ nuclei. Color-coded spheres show the puncta of FISH signals. The proportion of Aplnr+ cells in Lrg1+ cells in the peri-infarct areas was quantified. n = 4. **P < 0.01, two-tailed, unpaired t test. [Scale bars, 10 μm (low magnification) and 5 μm (3D rendering).]
