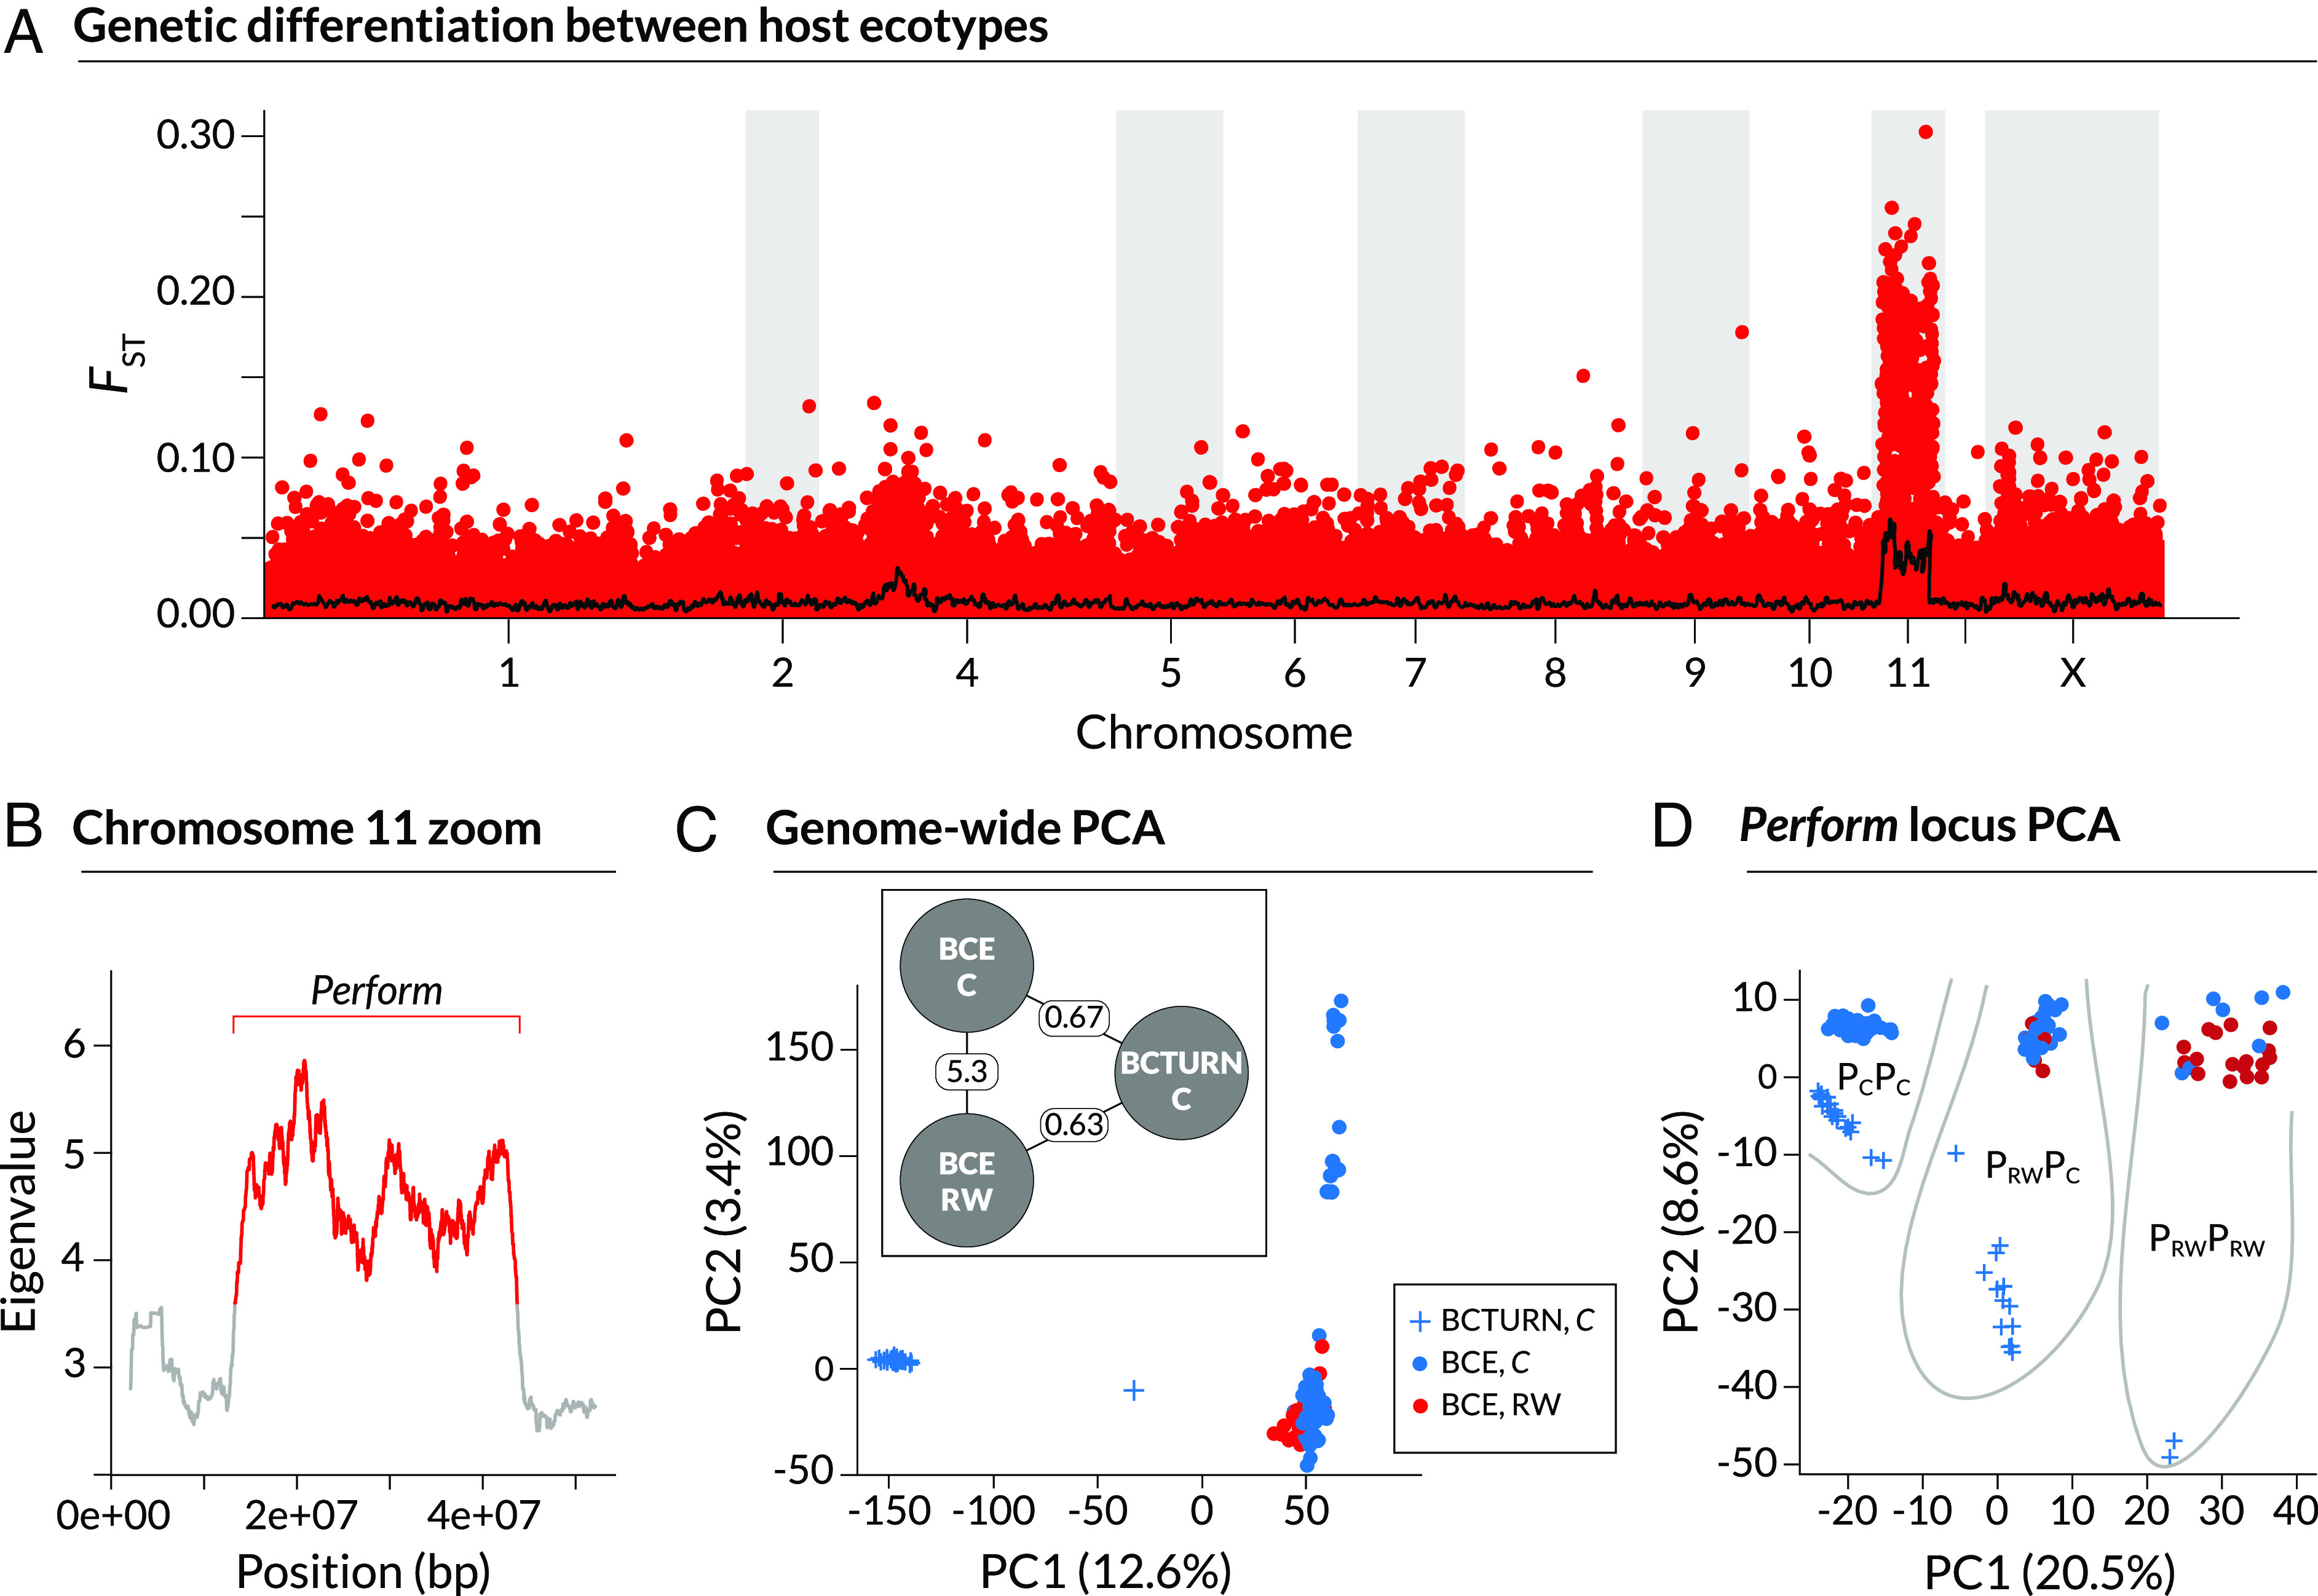
Fig. 2.

Genetic differentiation and structure associated with Redwood feeding in Timema knulli. These results are based on the new reference genome for T. knulli. (A) Manhattan plot of FST between stick insects collected on Ceanothus versus Redwood at the BCE locality. Points denote FST for individual SNPs; the solid line denotes mean FST in 100 SNP sliding windows. Timema knulli chromosomes are used here (chromosome 3 from T. cristinae is fused to chromosome 1; X = the X sex chromosome). Panel (B) shows (square roots of) eigenvalues for the first principal component of genetic variation in T. knulli (excluding BCTURN, an allopatric Ceanothus population) in 100 SNP overlapping, sliding windows along chromosome 11. Colors denote alternative states as identified by a Hidden Markov model (HMM), with red denoting the elevated eigenvalue state and defining the bounds for the “Perform” locus on chromosome 11 (text for details). Panels (C) and (D) show summaries of genetic variation in T. knulli based on principal components analysis (PCA) for all SNPs not on chromosome 11 (C) and for the Perform locus only (D). Values for the first two principal components are shown with colors and symbols denoting locations and hosts. The inset in (C) is a schematic for the model used to infer neutral rates of gene flow among populations: BCE C (on Ceanothus), BCE RW (on Redwood) and BCTURN C (on Ceanothus). Point estimates of Nm, that is the number of migrants exchanged per generation, are shown on lines connecting the populations, and are consistent with a pattern of isolation by geographic distance. The ellipses in (D) delimit Perform locus genotypes based on PC clusters.
