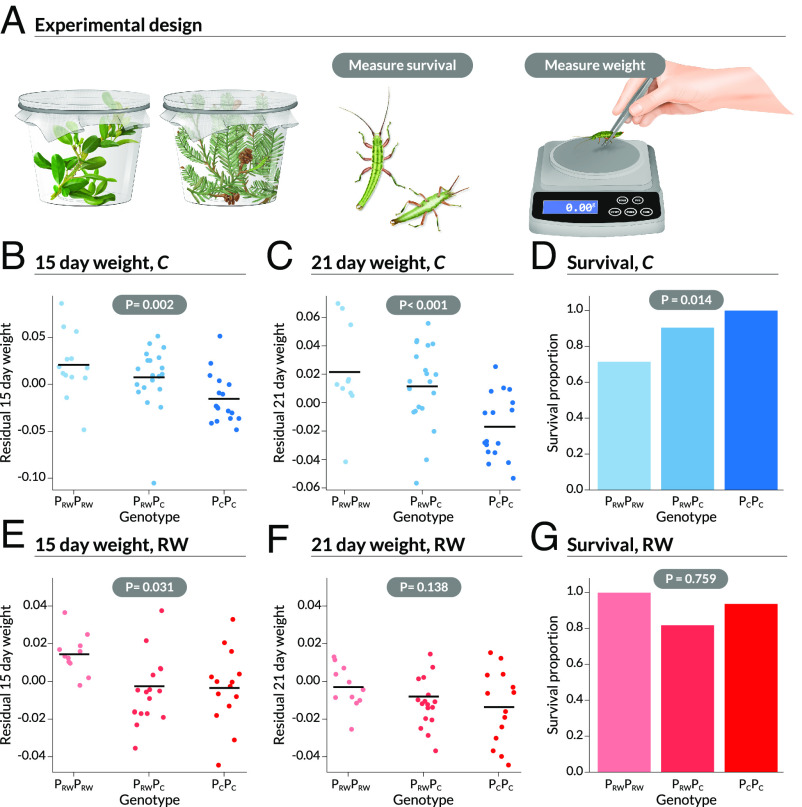
Fig. 4.
Summary of the rearing and genetic mapping experiments. Panel (A) illustrates the experimental design. Panels (B) and (C) show 15- and 21-d weight for T. knulli reared on Ceanothus based on their Perform genotype (PRWPRW, PCPRW, and PCPC). Points denote individuals (with a small jitter applied to the x-axis), horizontal lines give means for each genotype. The P-value for the null hypothesis of no effect of Perform is shown. A barplot (D) shows survival proportions on Ceanothus along with the P-value for the null model of no effect of genotype on survival. Analogous results are shown for T. knulli on Redwood (RW, Sequoia) in (E) (15-d weight), (F) (21-d weight) and (G) (survival).

