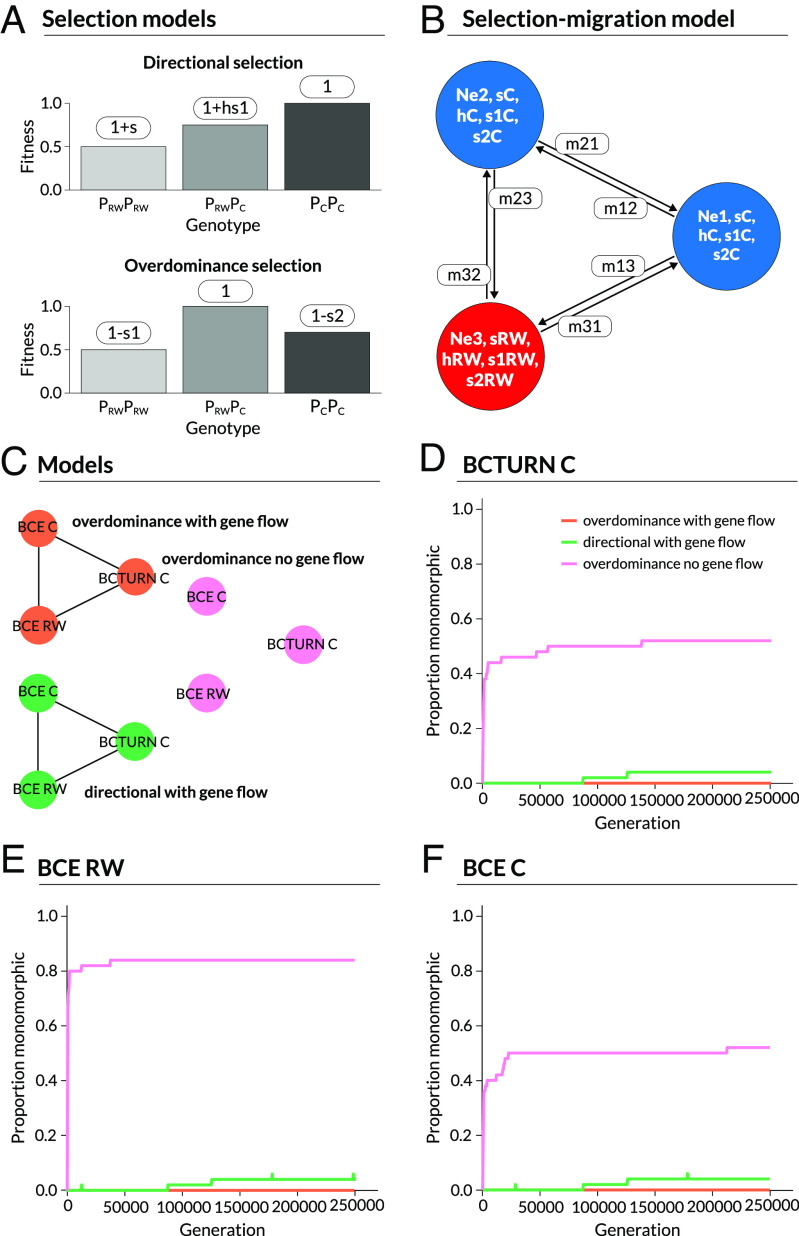
Fig. 5.
Summary of the approximate Bayesian computation (ABC) model and inferences and simulations testing the effects of selection and gene flow on the maintenance of polymorphism at the Perform locus. Panel (A) illustrates the fitness schemes and definitions of selection coefficients under directional selection selection versus heterozygote advantage. Specifically, for directional selection s denotes the difference in relative fitness for alternative homozygotes and h gives the heterozygote effect (with 0 < h < 1), whereas for heterozygote advantage s1 and s2 denote the reductions in fitness for homozygotes relative to the heterozygote. Panel (B) summarizes the demographic component of the model. Colored circles correspond with populations with colors denoting host, red = Redwood and blue = Ceanothus. Populations have distinct effective population sizes (Ne) and selection coefficients (either s and h or s1 and s2) dictated by host (RW = Redwood or C = Ceanothus). Asymmetric gene flow is allowed as indicated by the migration edges. Panel (C) illustrates the three models–heterozygote advantage with gene flow (our best model), divergent directional selection with gene flow, and heterozygote advantage without gene flow–that we consider for the three focal populations analyzed with the ABC model, BCE on Ceanothus (BCE C), BCE on Redwood (BCE RW) and BCTURN (an allopatric Ceanothus population). Panels (D)–(F) show the proportion of replicate simulations in which variation at Perform was lost over time, that is the proportion of monomorphic replicates at time, in BCTURN (D), BCE RW (E) and BCE C (F).

