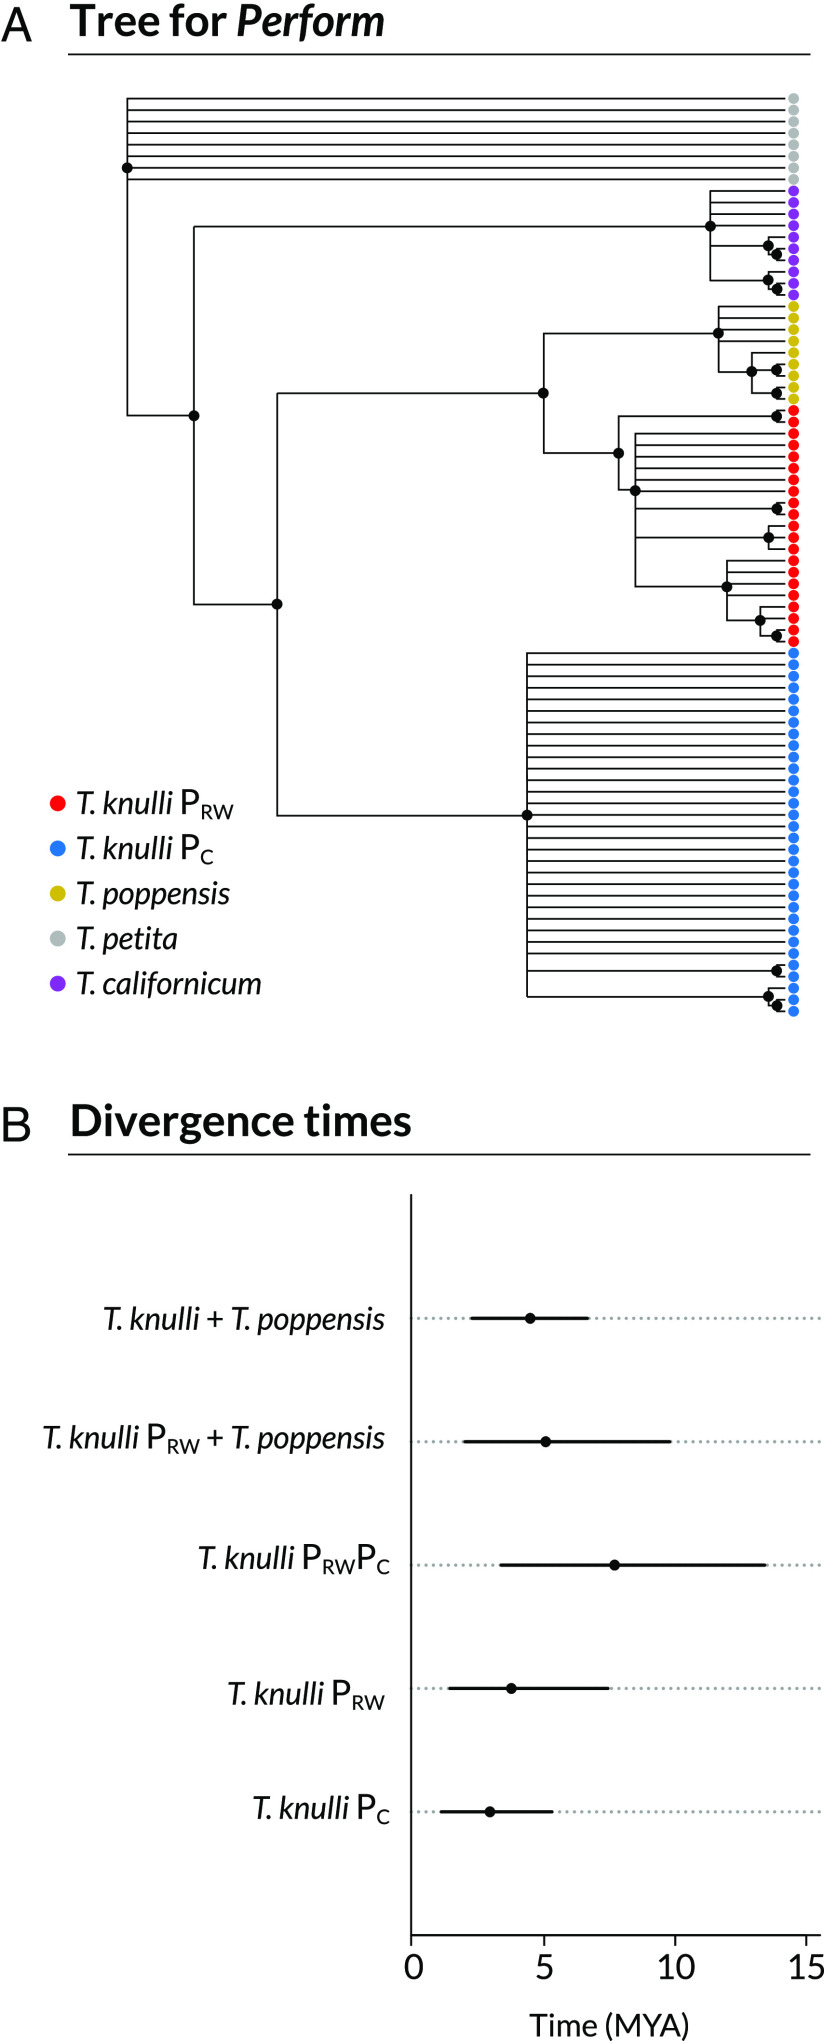
Fig. 6.
Evidence that Perform is an ancient inversion. Panel (A) shows the phylogeny for the Perform locus estimated with BEAST2. Colored points indicate taxa and inversion alleles (for T. knulli only) (PRW and PC). Bifurcations with posterior probability > 0.5 are shown with pie charts colored to denote posterior probabilities. Panel (B) shows the corresponding Bayesian posterior distributions for divergence times for T. knulli and T. poppensis based on genome-wide SNP data, for the T. knulliPRW chromosomal variant and T. poppensis based on SNPs within the Perform locus, and for SNPs within the T. knulliPRW and PCPerform chromosomal variants together and each alone. Points and horizontal lines denote posterior medians and 95% equal-tail probability intervals [ETPIs], respectively.

