Figure 2.

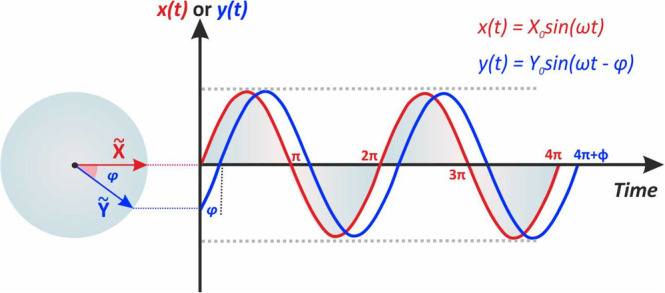
Phasor diagrams for the sinusoidal signals x(t) and y(t). The immobile vectors after a specific time correspond to the phasors X̃ and Ỹ and the phase difference between them.

Phasor diagrams for the sinusoidal signals x(t) and y(t). The immobile vectors after a specific time correspond to the phasors X̃ and Ỹ and the phase difference between them.