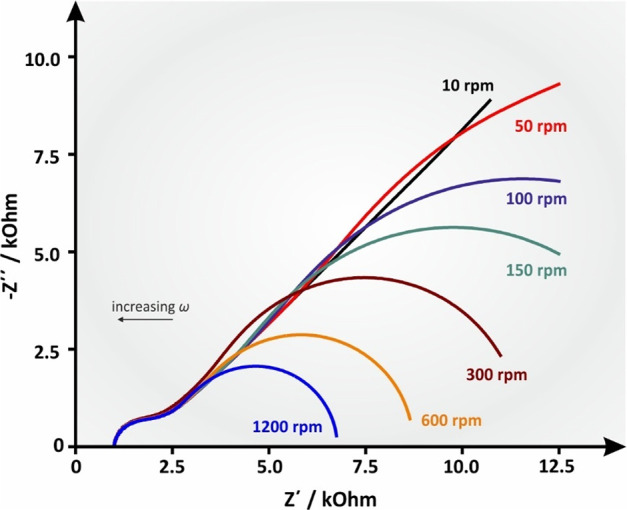
Figure 20.

Simulated Nyquist plot of an RDE experiment with increasing angular velocity (ω) values, leading to increasing B values. Ru = 1000 Ohm, Cdl = 10–6 F, Rct = 1000 ohm, Y0 = 10–4 s1/2 ohm–1, B = 5.222 s–1 (ω = 10 rpm), B = 2.335 s–1 (ω = 50 rpm), B = 1.651 s–1 (ω = 100 rpm), B = 1.348 s–1 (ω = 150 rpm), B = 0.953 s–1 (ω = 300 rpm), B = 0.674 s–1 (ω = 600 rpm), and B = 0.477 s–1 (ω = 1200 rpm). D was deemed to be 7.6 × 10⁻⁶, as per the well-known redox couple ferro/ferricyanide, and ν was 0.01 cm2 s–1, which is the approximate value of water’s kinematic viscosity at 25 °C.
