Figure 21.

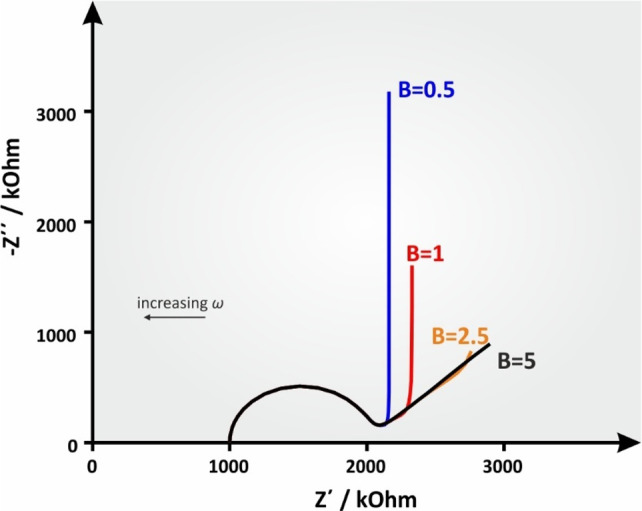
Simulated Nyquist plots of an ideal electrode surface with a reflective boundary at various (from 0.5 to 5 s–1) B values. Ru = 1000 ohm, Cdl = 10–6 F, Rct = 1000 ohm, Y0 = 10–3 s1/2 ohm–1.

Simulated Nyquist plots of an ideal electrode surface with a reflective boundary at various (from 0.5 to 5 s–1) B values. Ru = 1000 ohm, Cdl = 10–6 F, Rct = 1000 ohm, Y0 = 10–3 s1/2 ohm–1.